SKILL DEVELOPMENT COURSE - (DATA VISUALIZATION - R PROGRAMMING/ POWER BI)
Aim:
Editing and Formatting Axes, Manipulating Data in Tableau data, Pivoting Tableau data.
Solution :
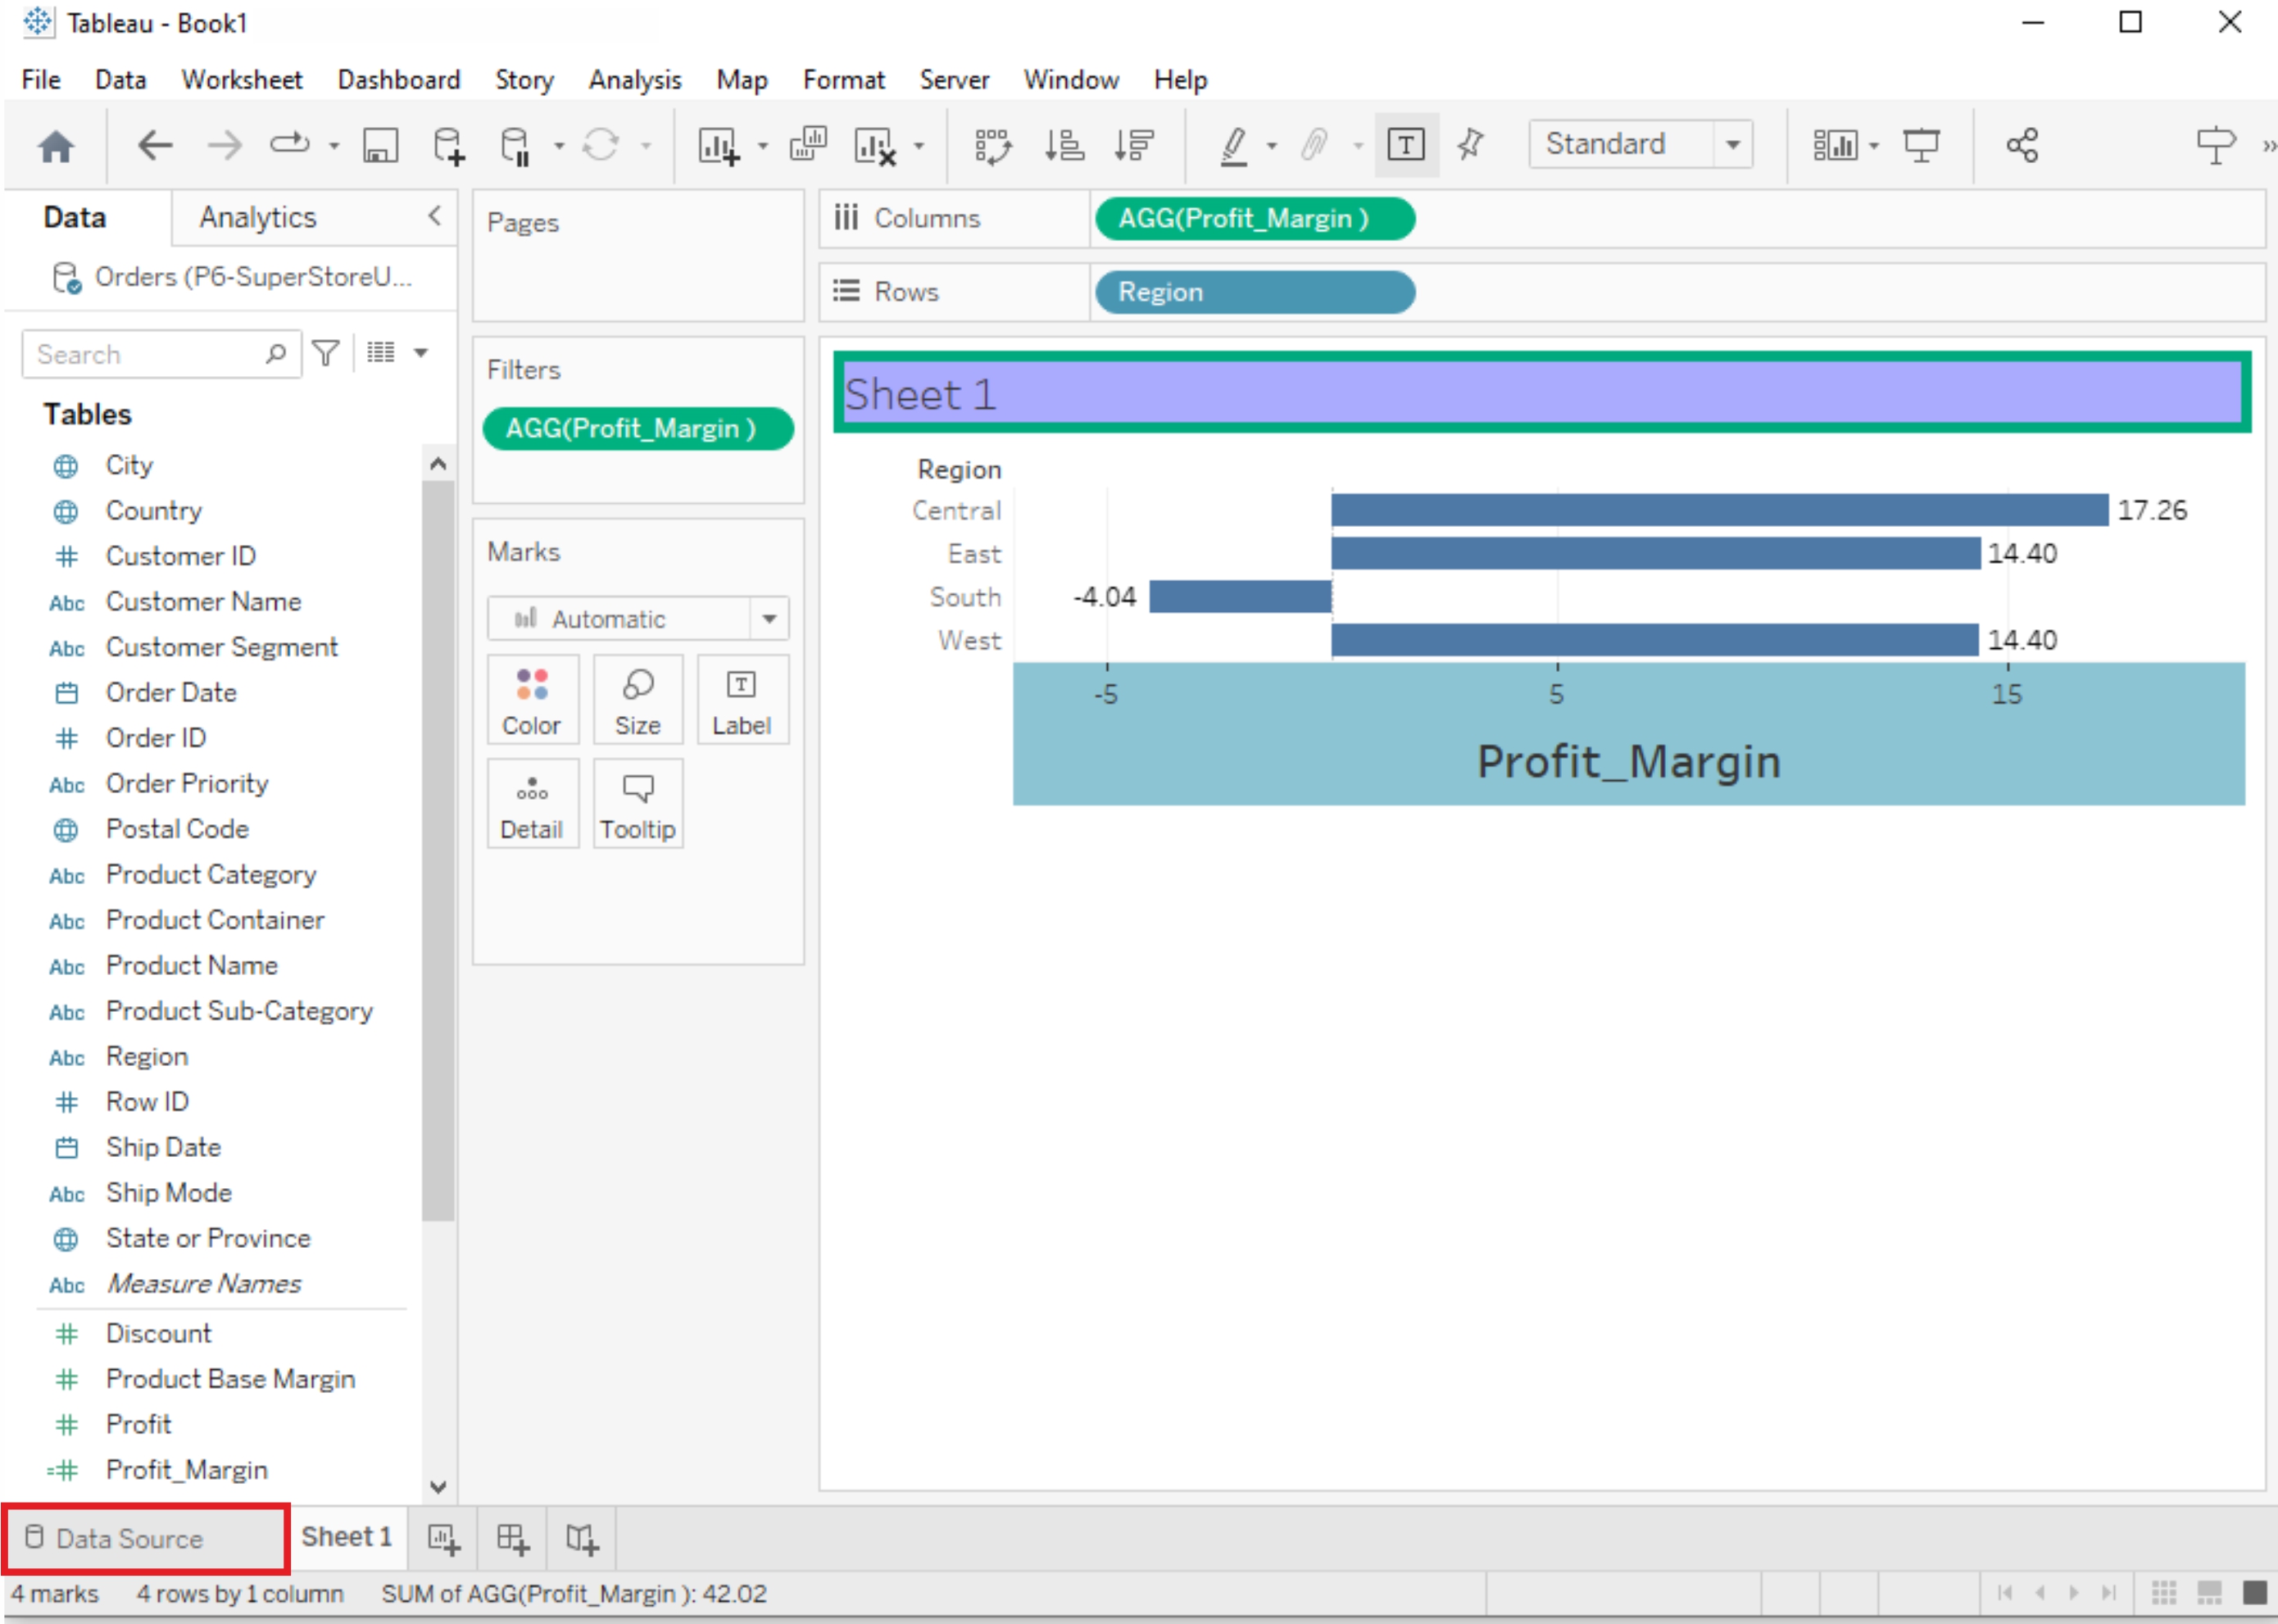
Editing and Formatting Axes:
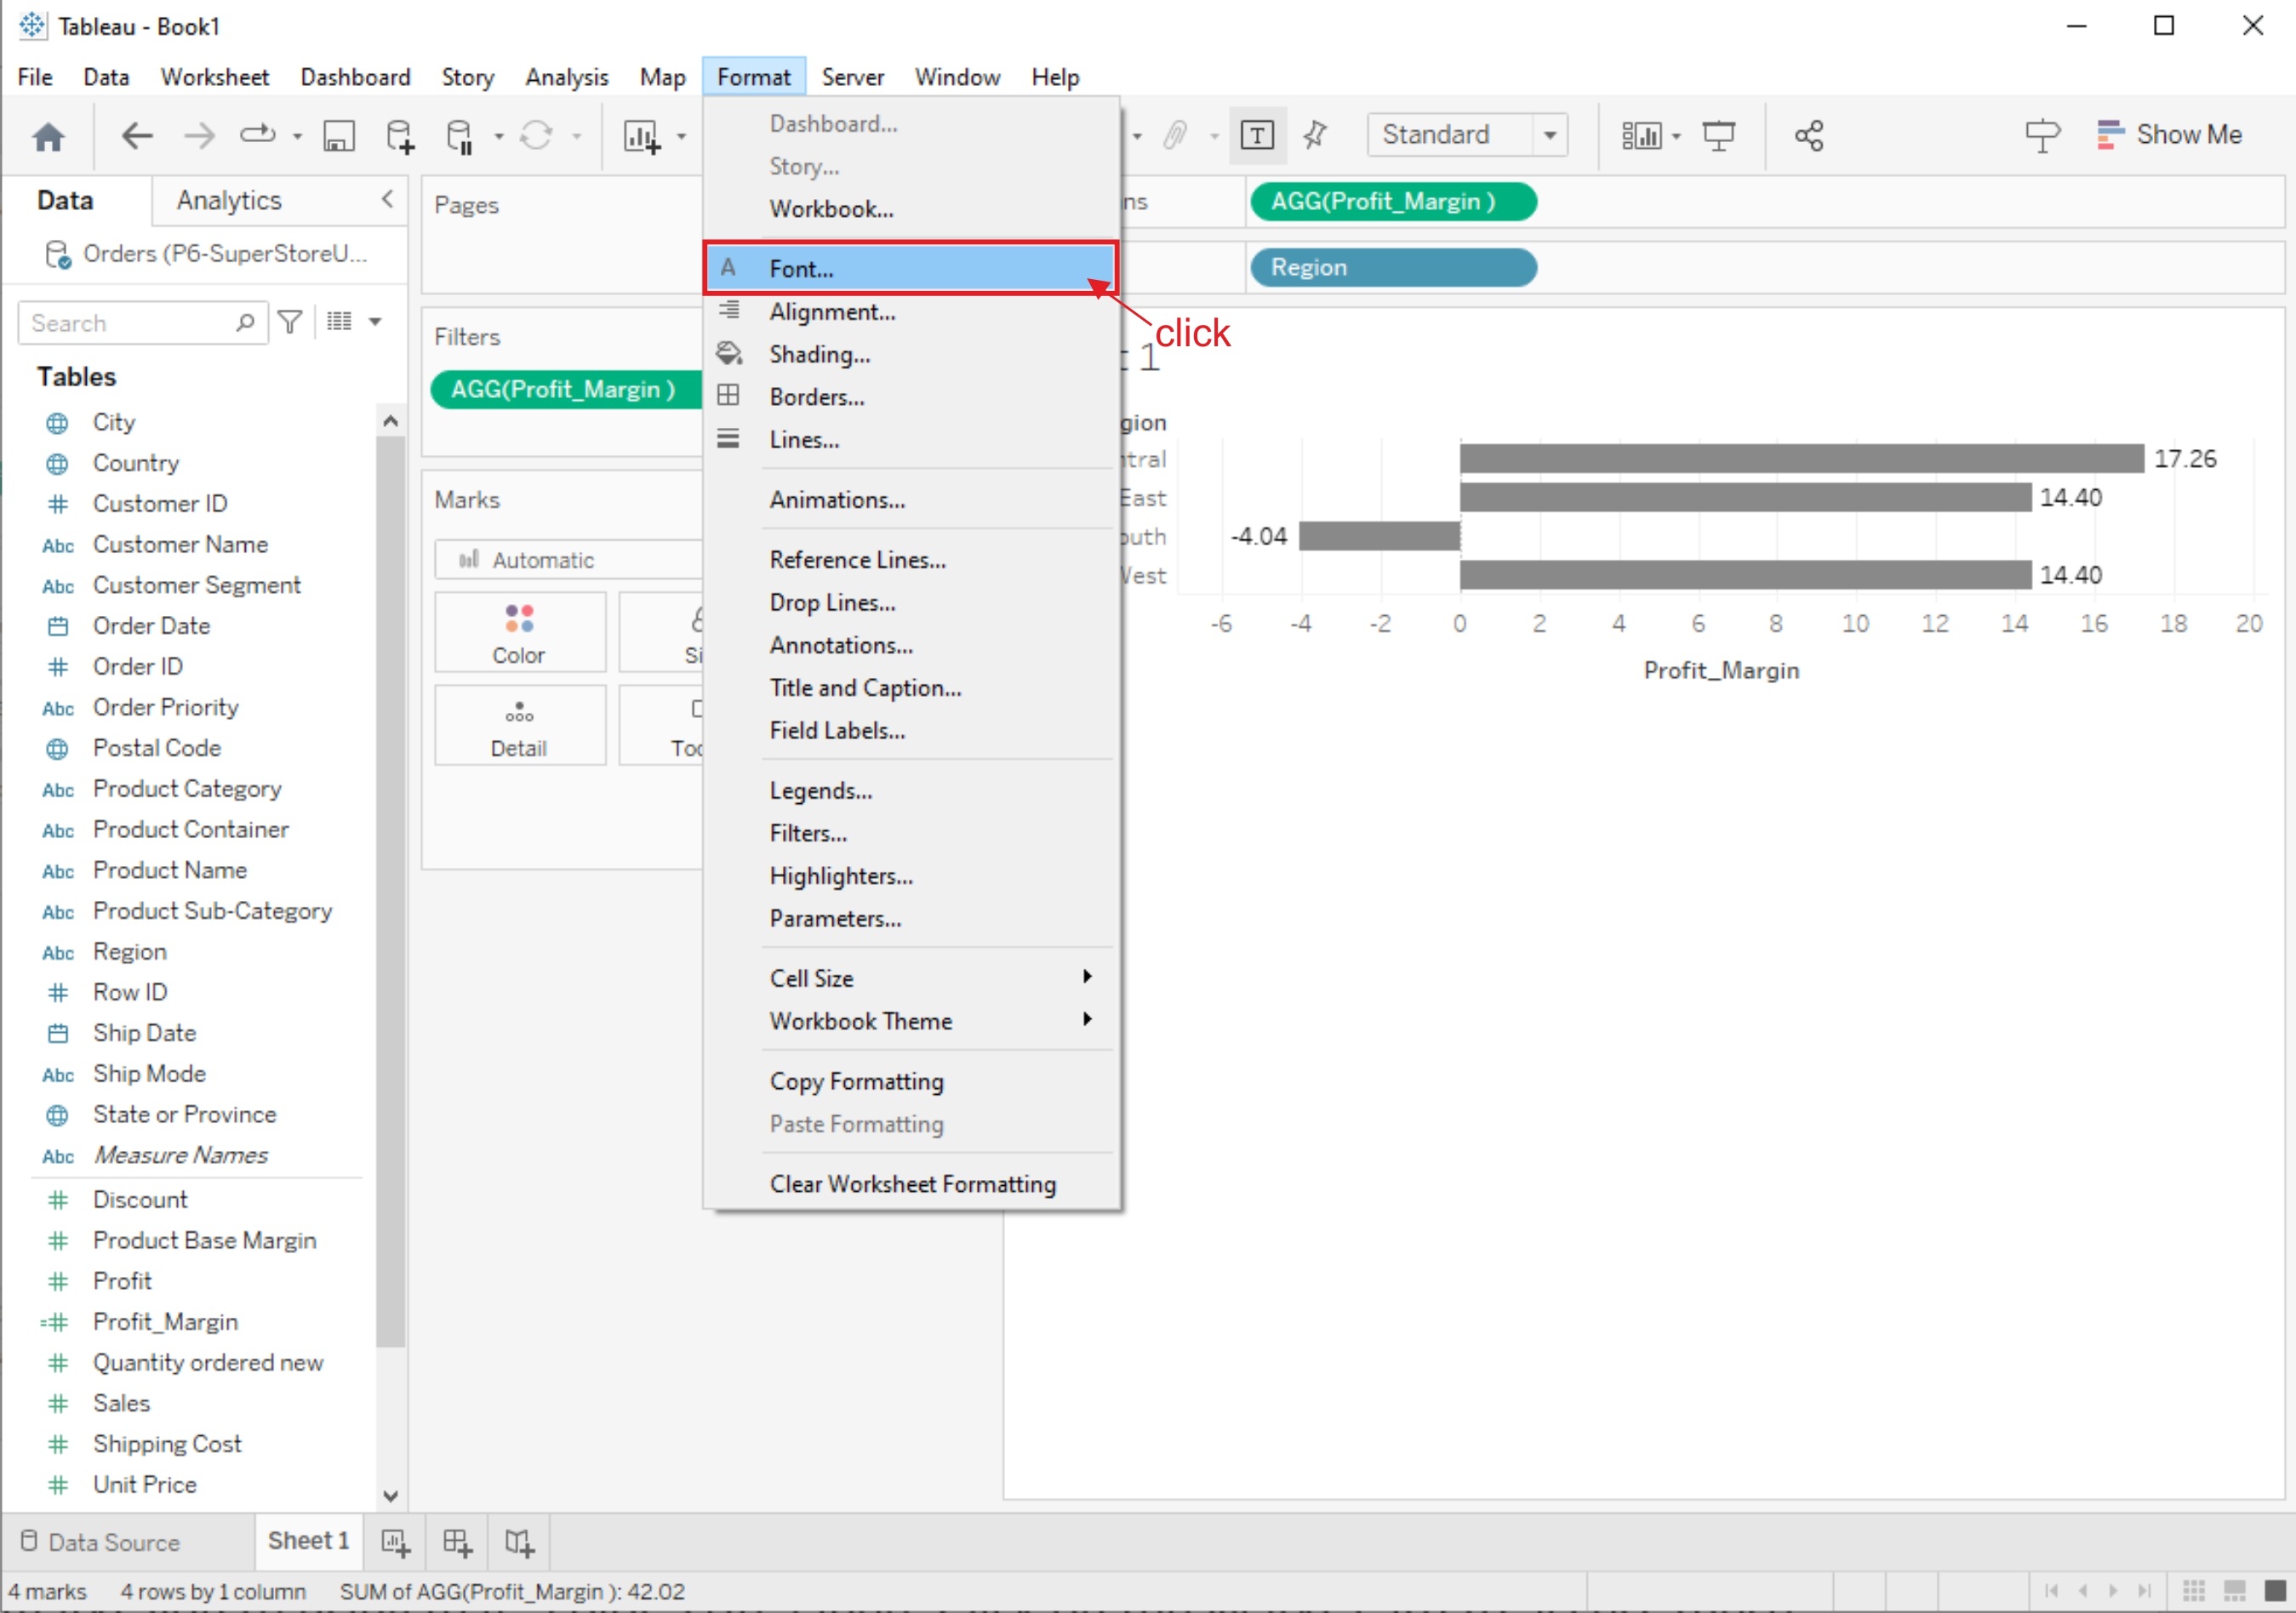
1. Edit Axis Title:
- Click on the axis title you want to edit.
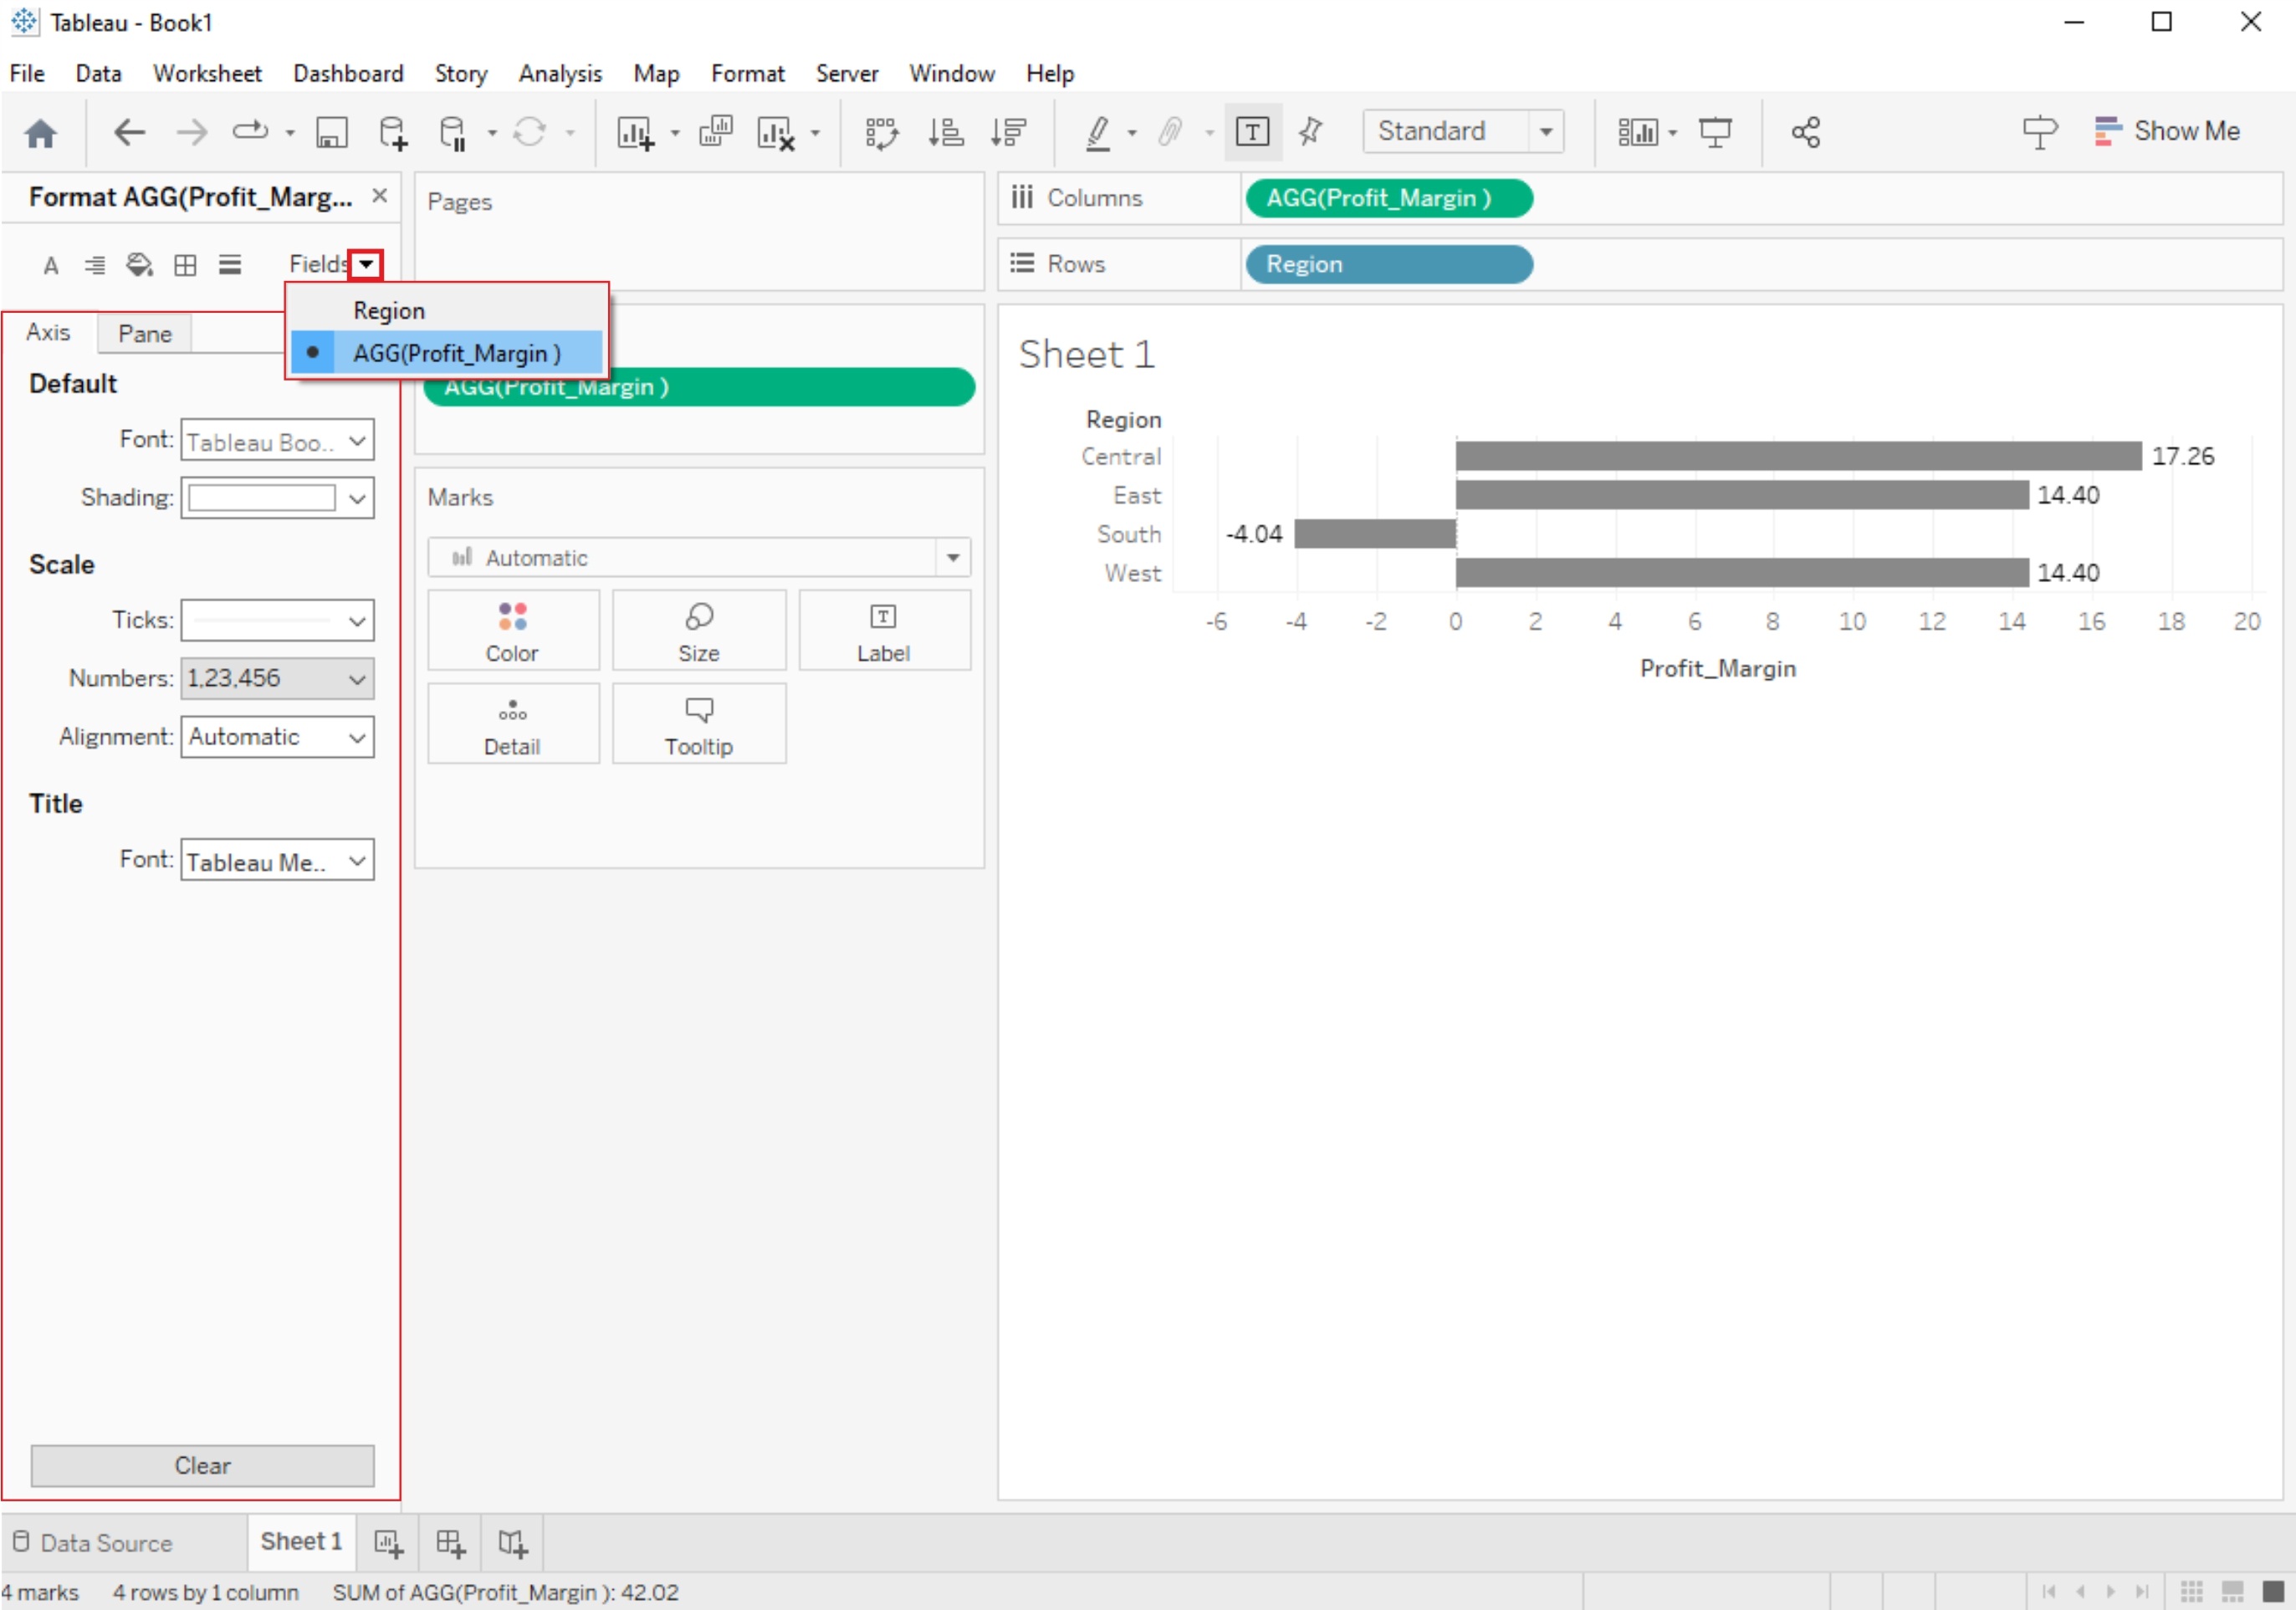
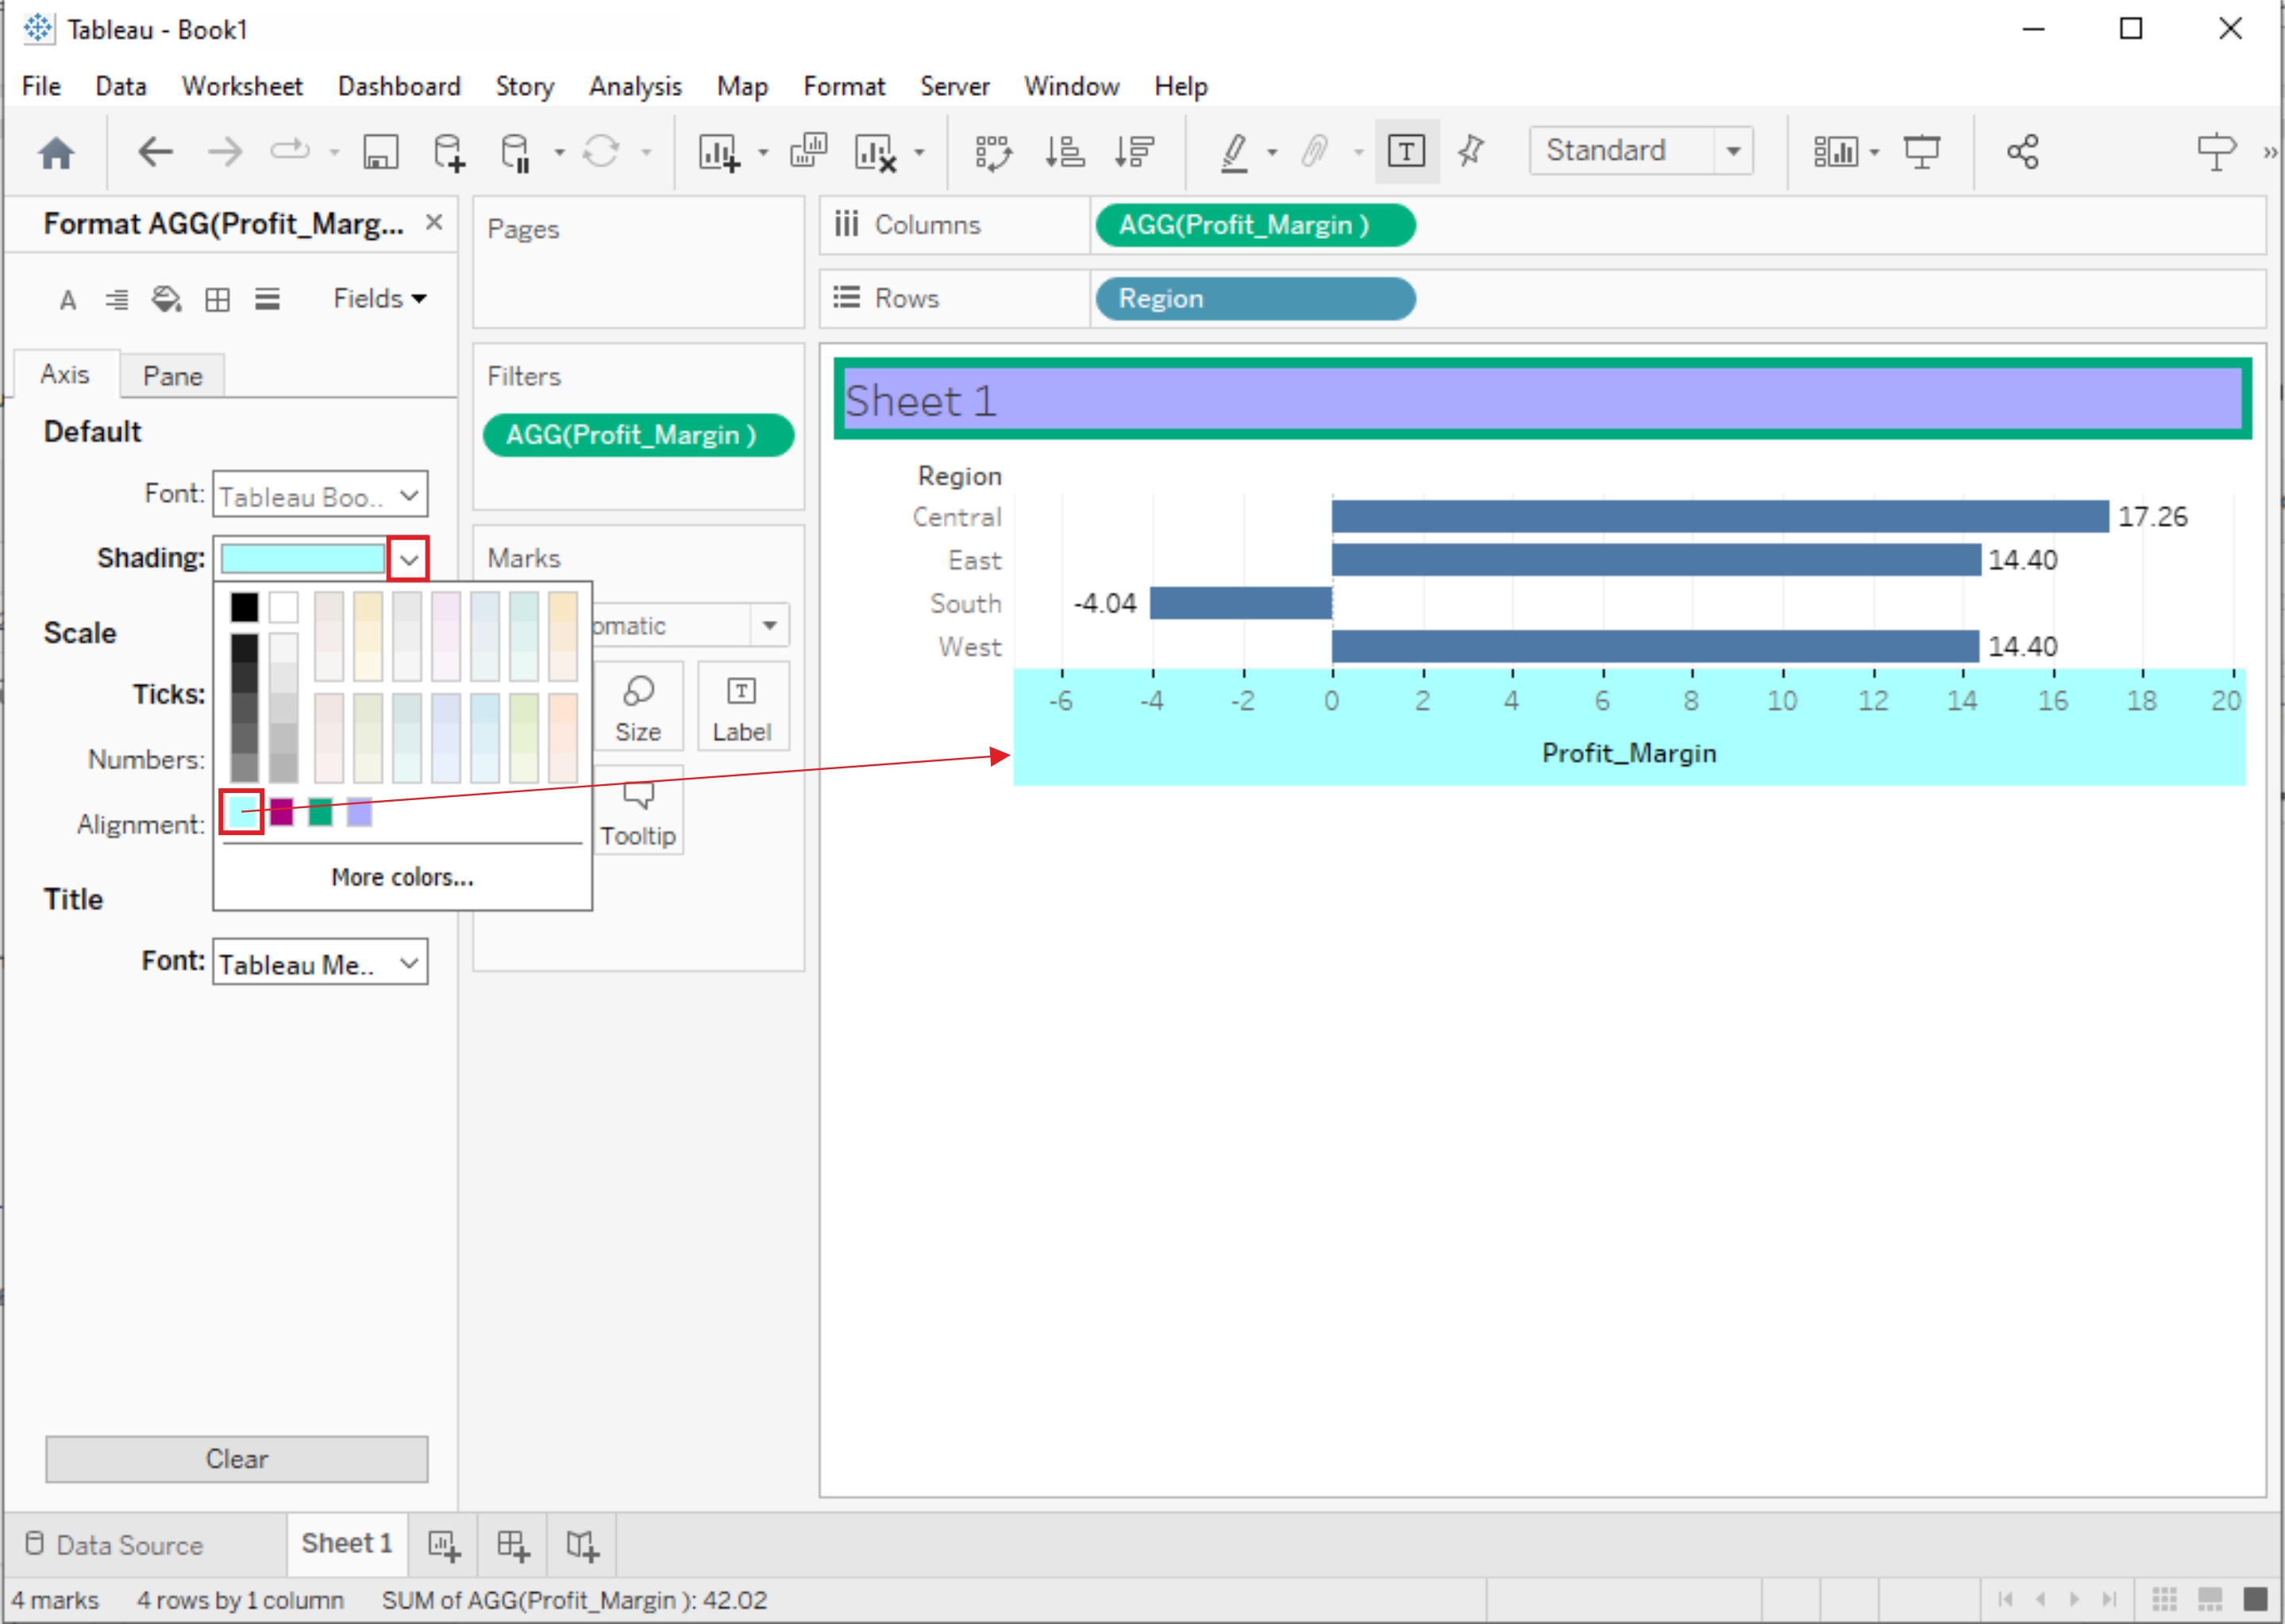
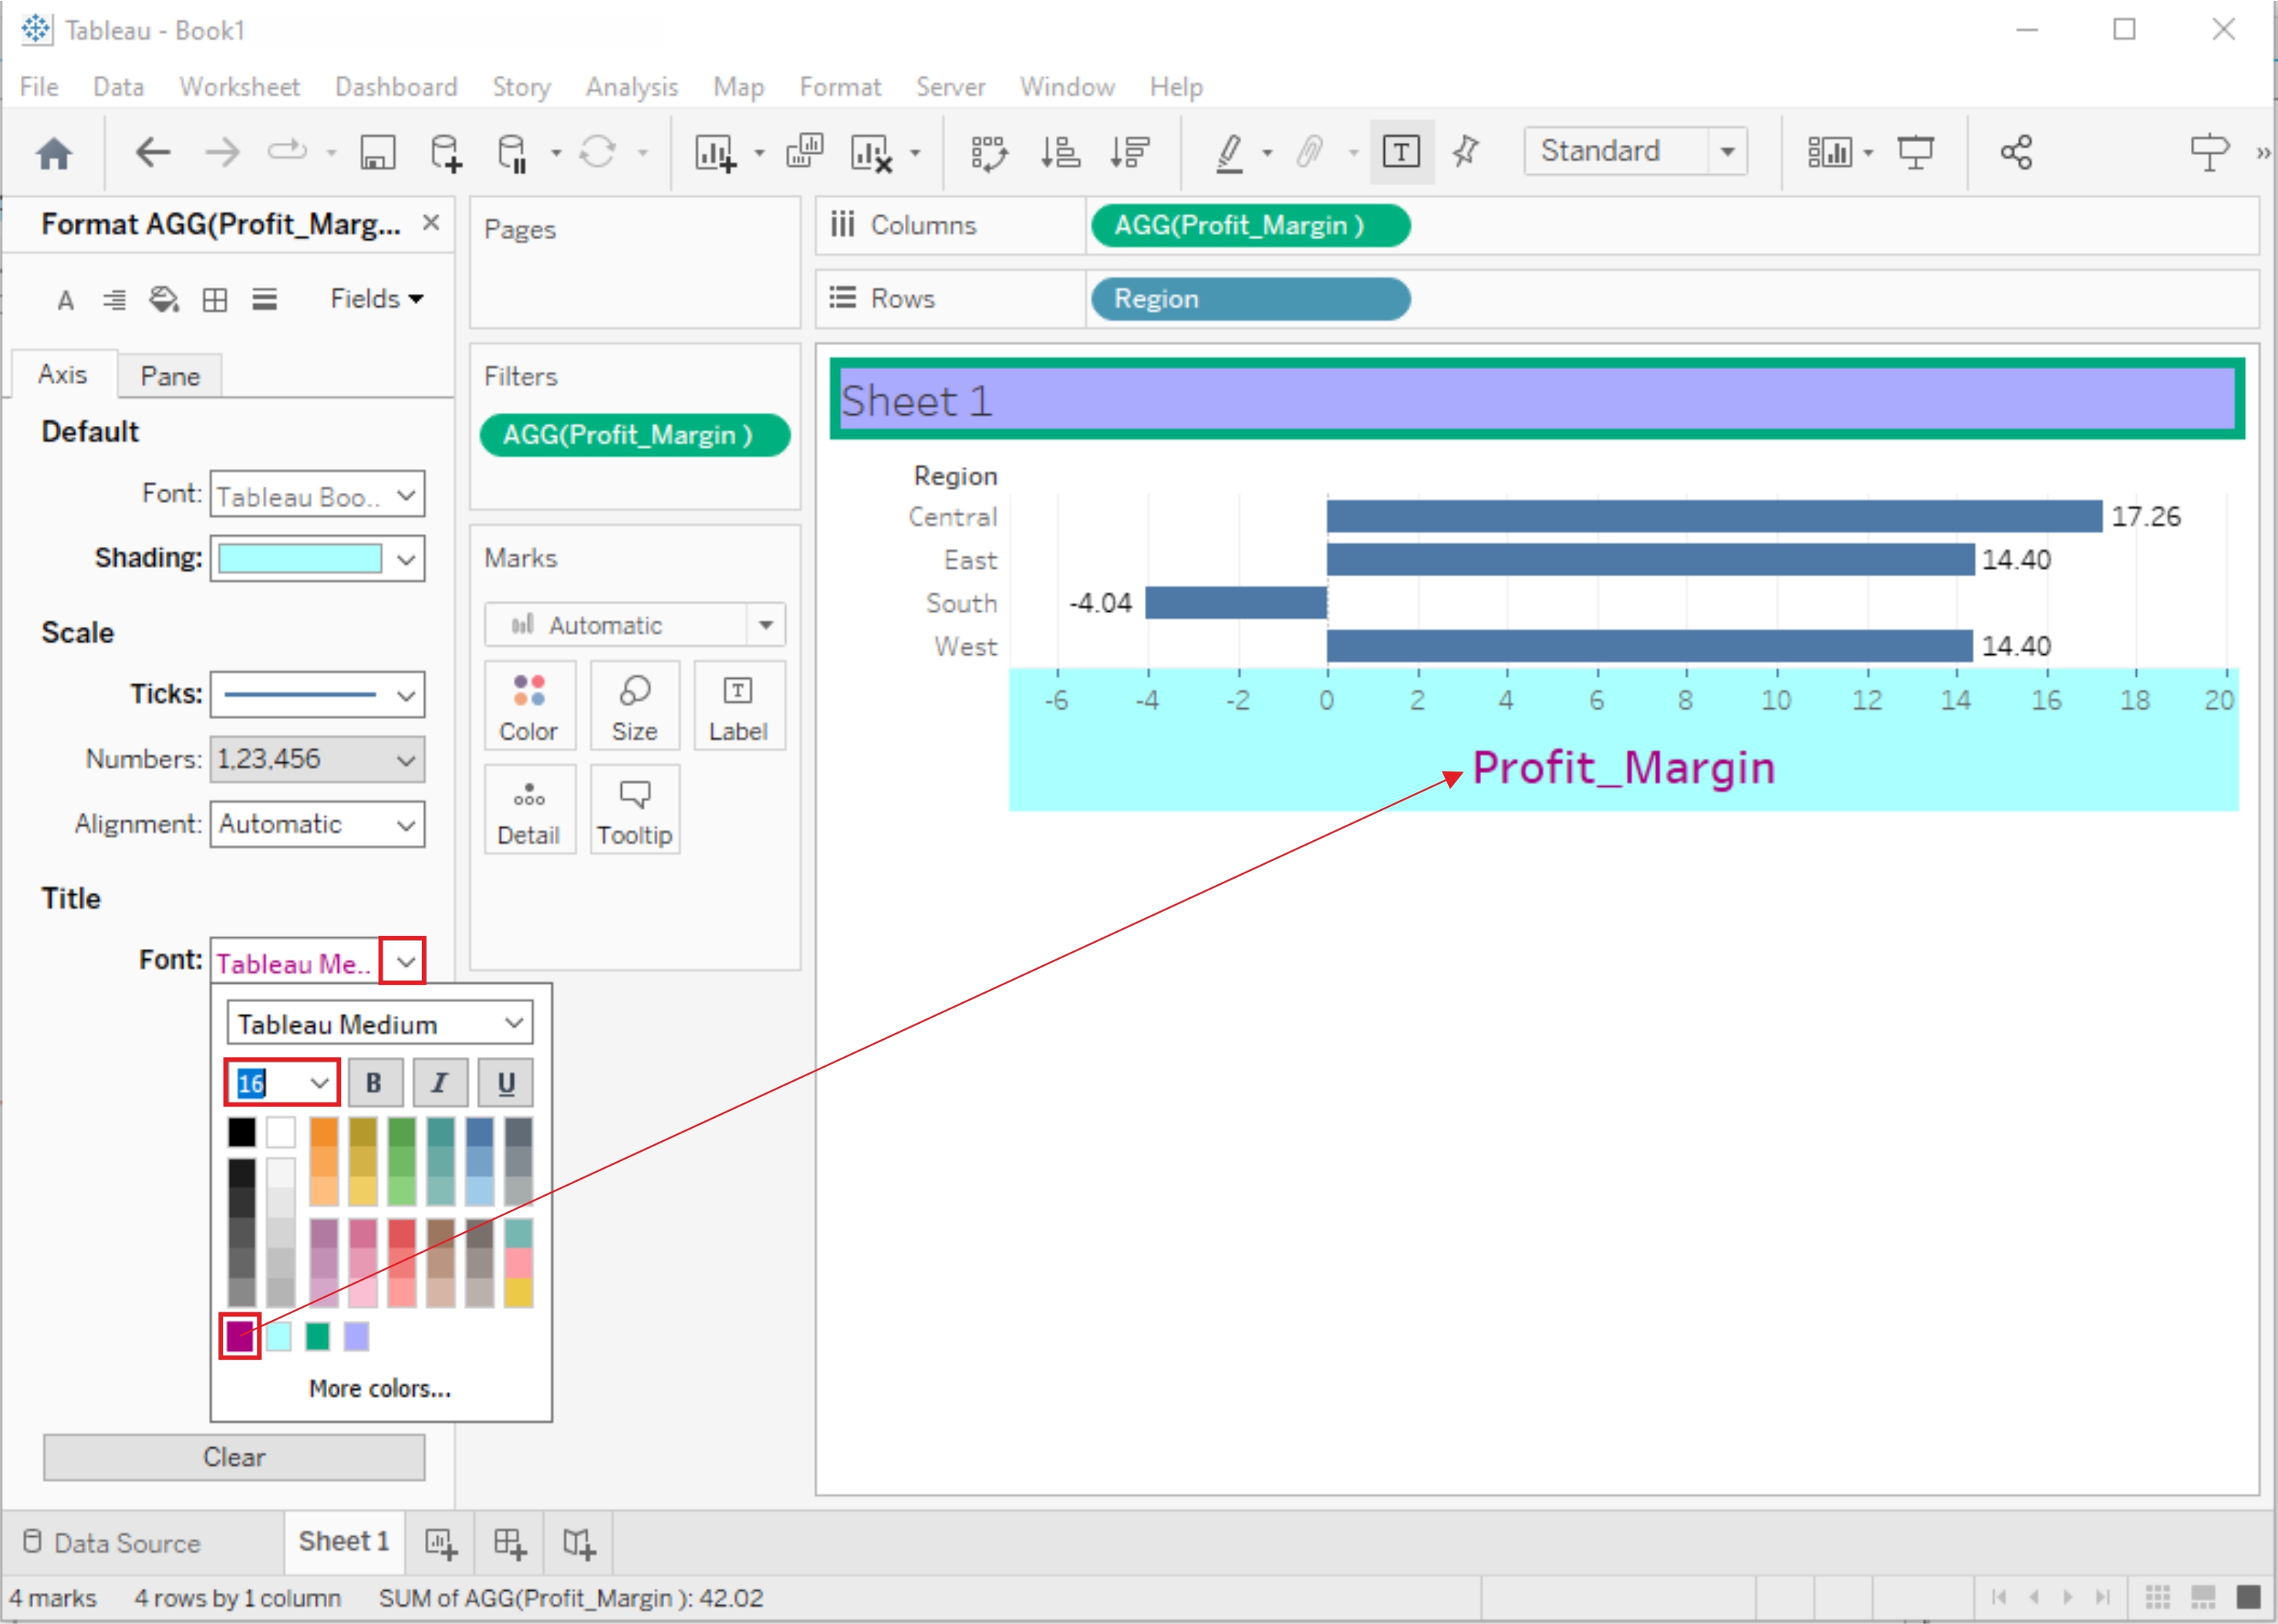
- You can now modify the title text, font, size, color, and alignment using the Format pane or the toolbar at the top.
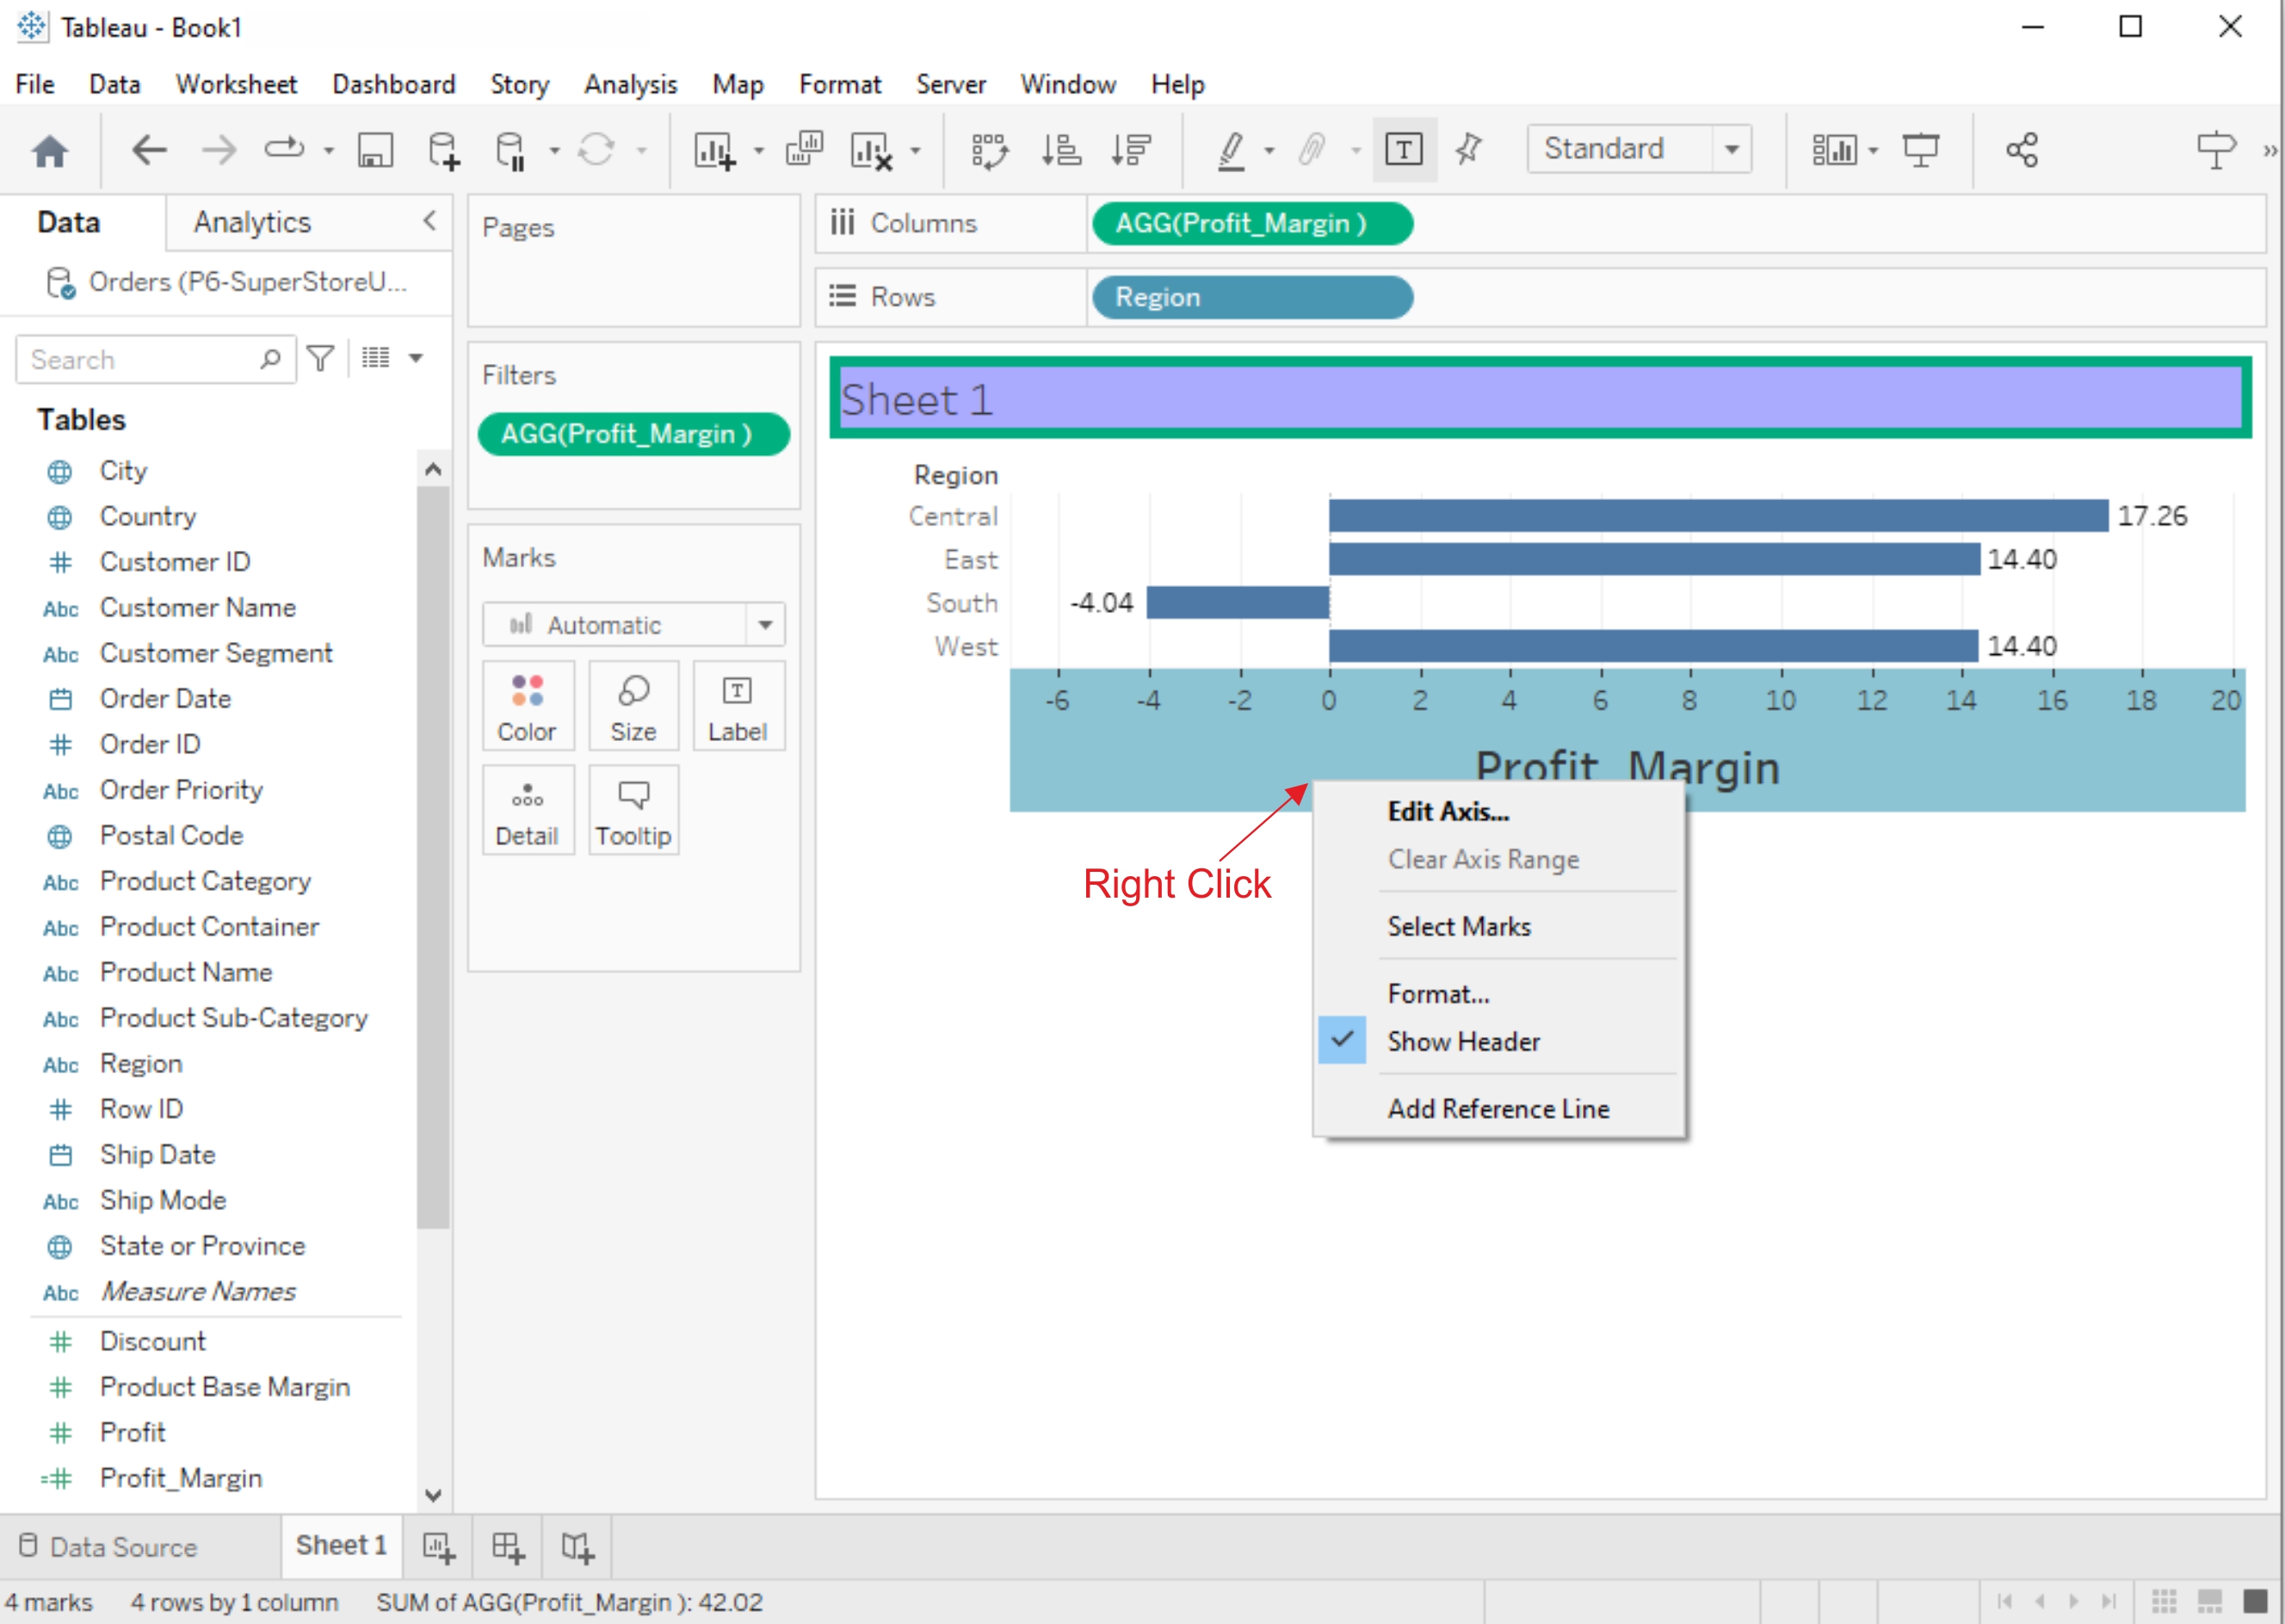
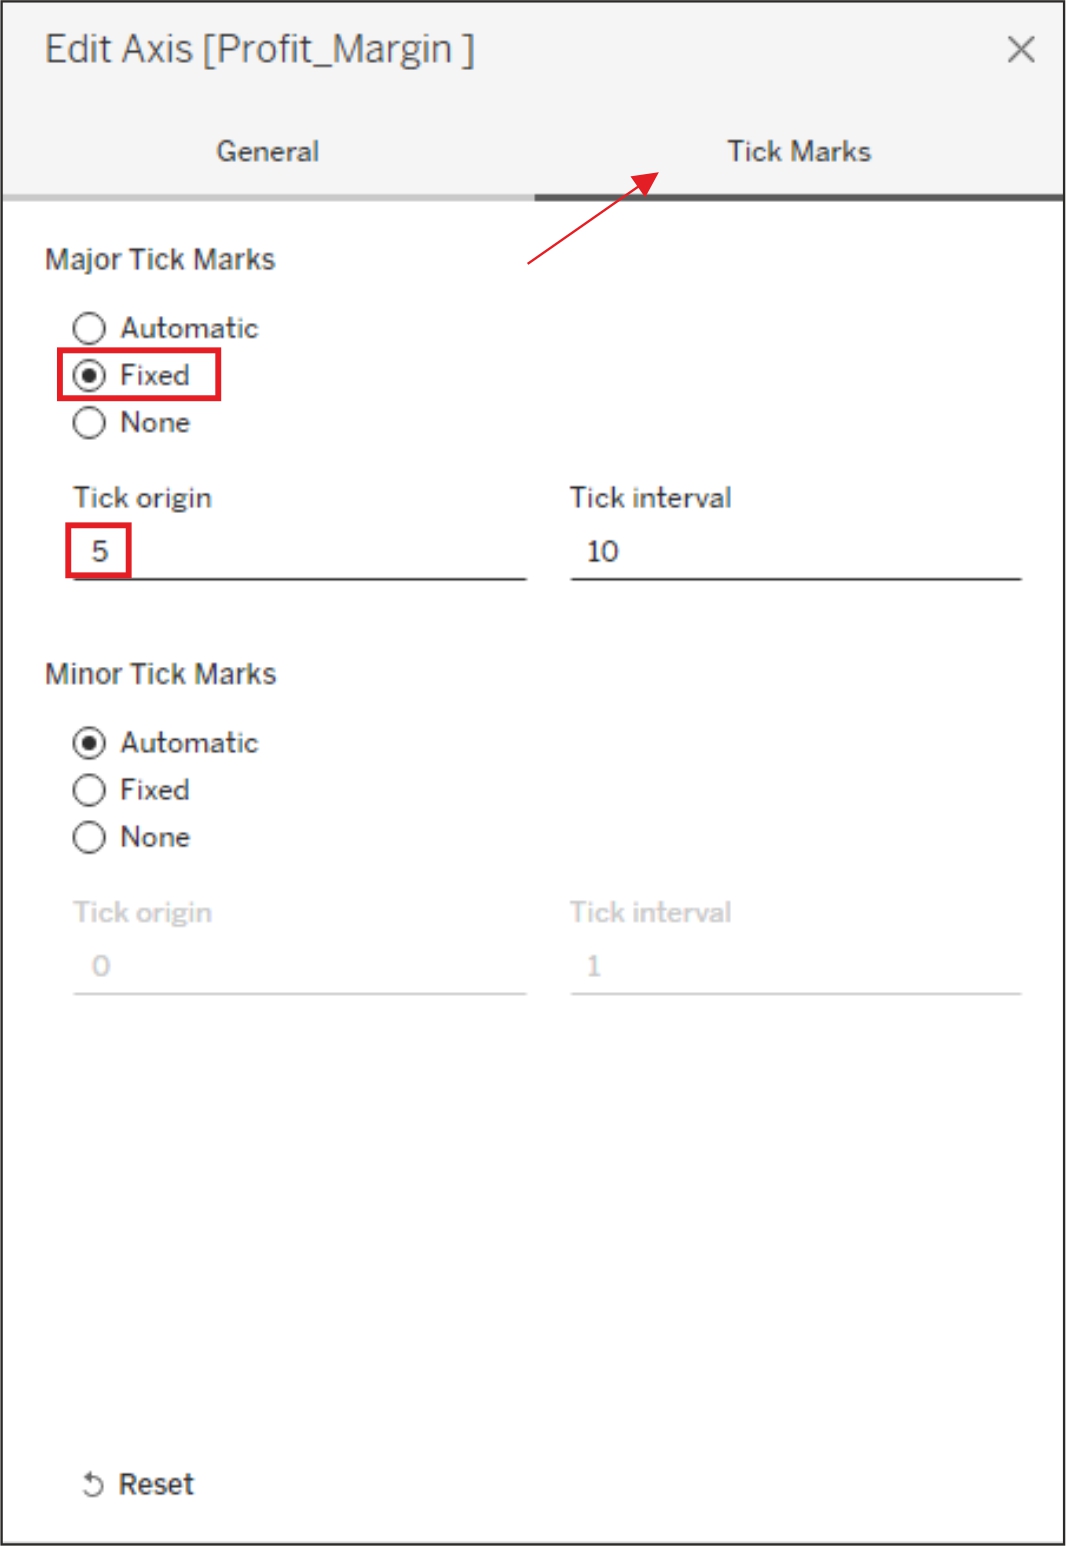
2. Edit Axis Labels:
- Right-click on an axis and select "Edit Axis."
- In the Edit Axis dialog box, you can change the formatting of labels, tick marks, and other axis-related properties.
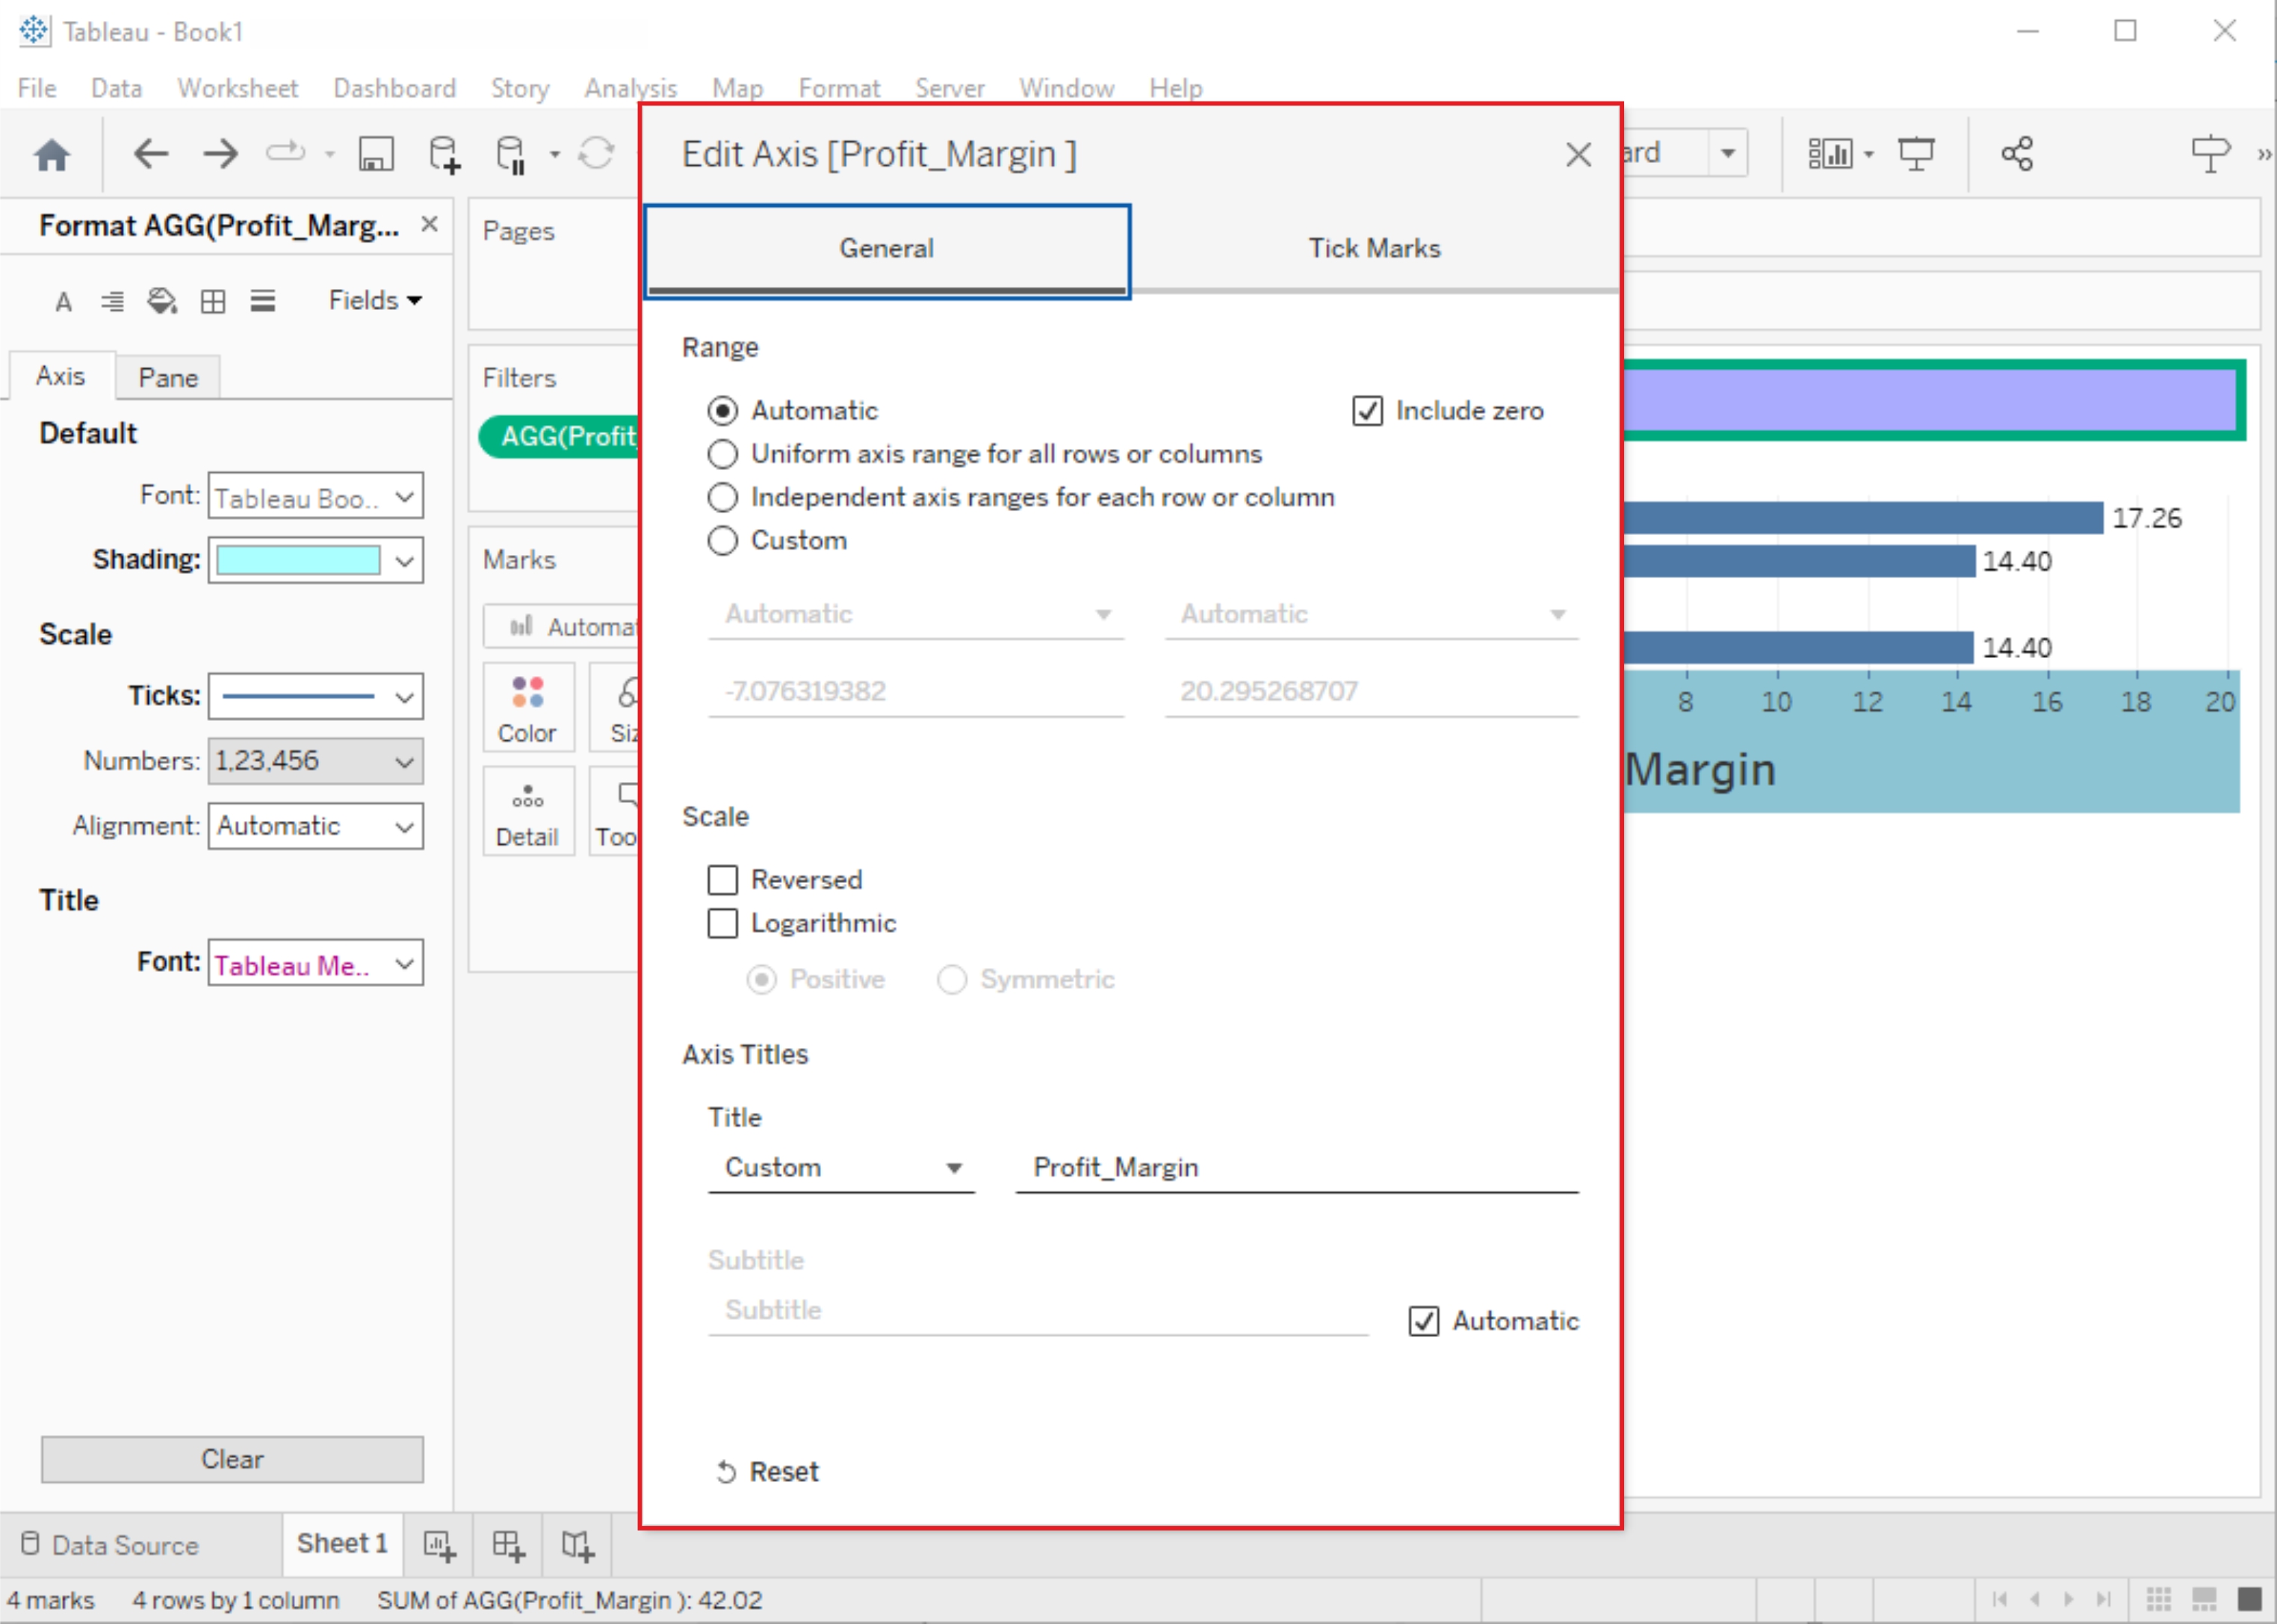
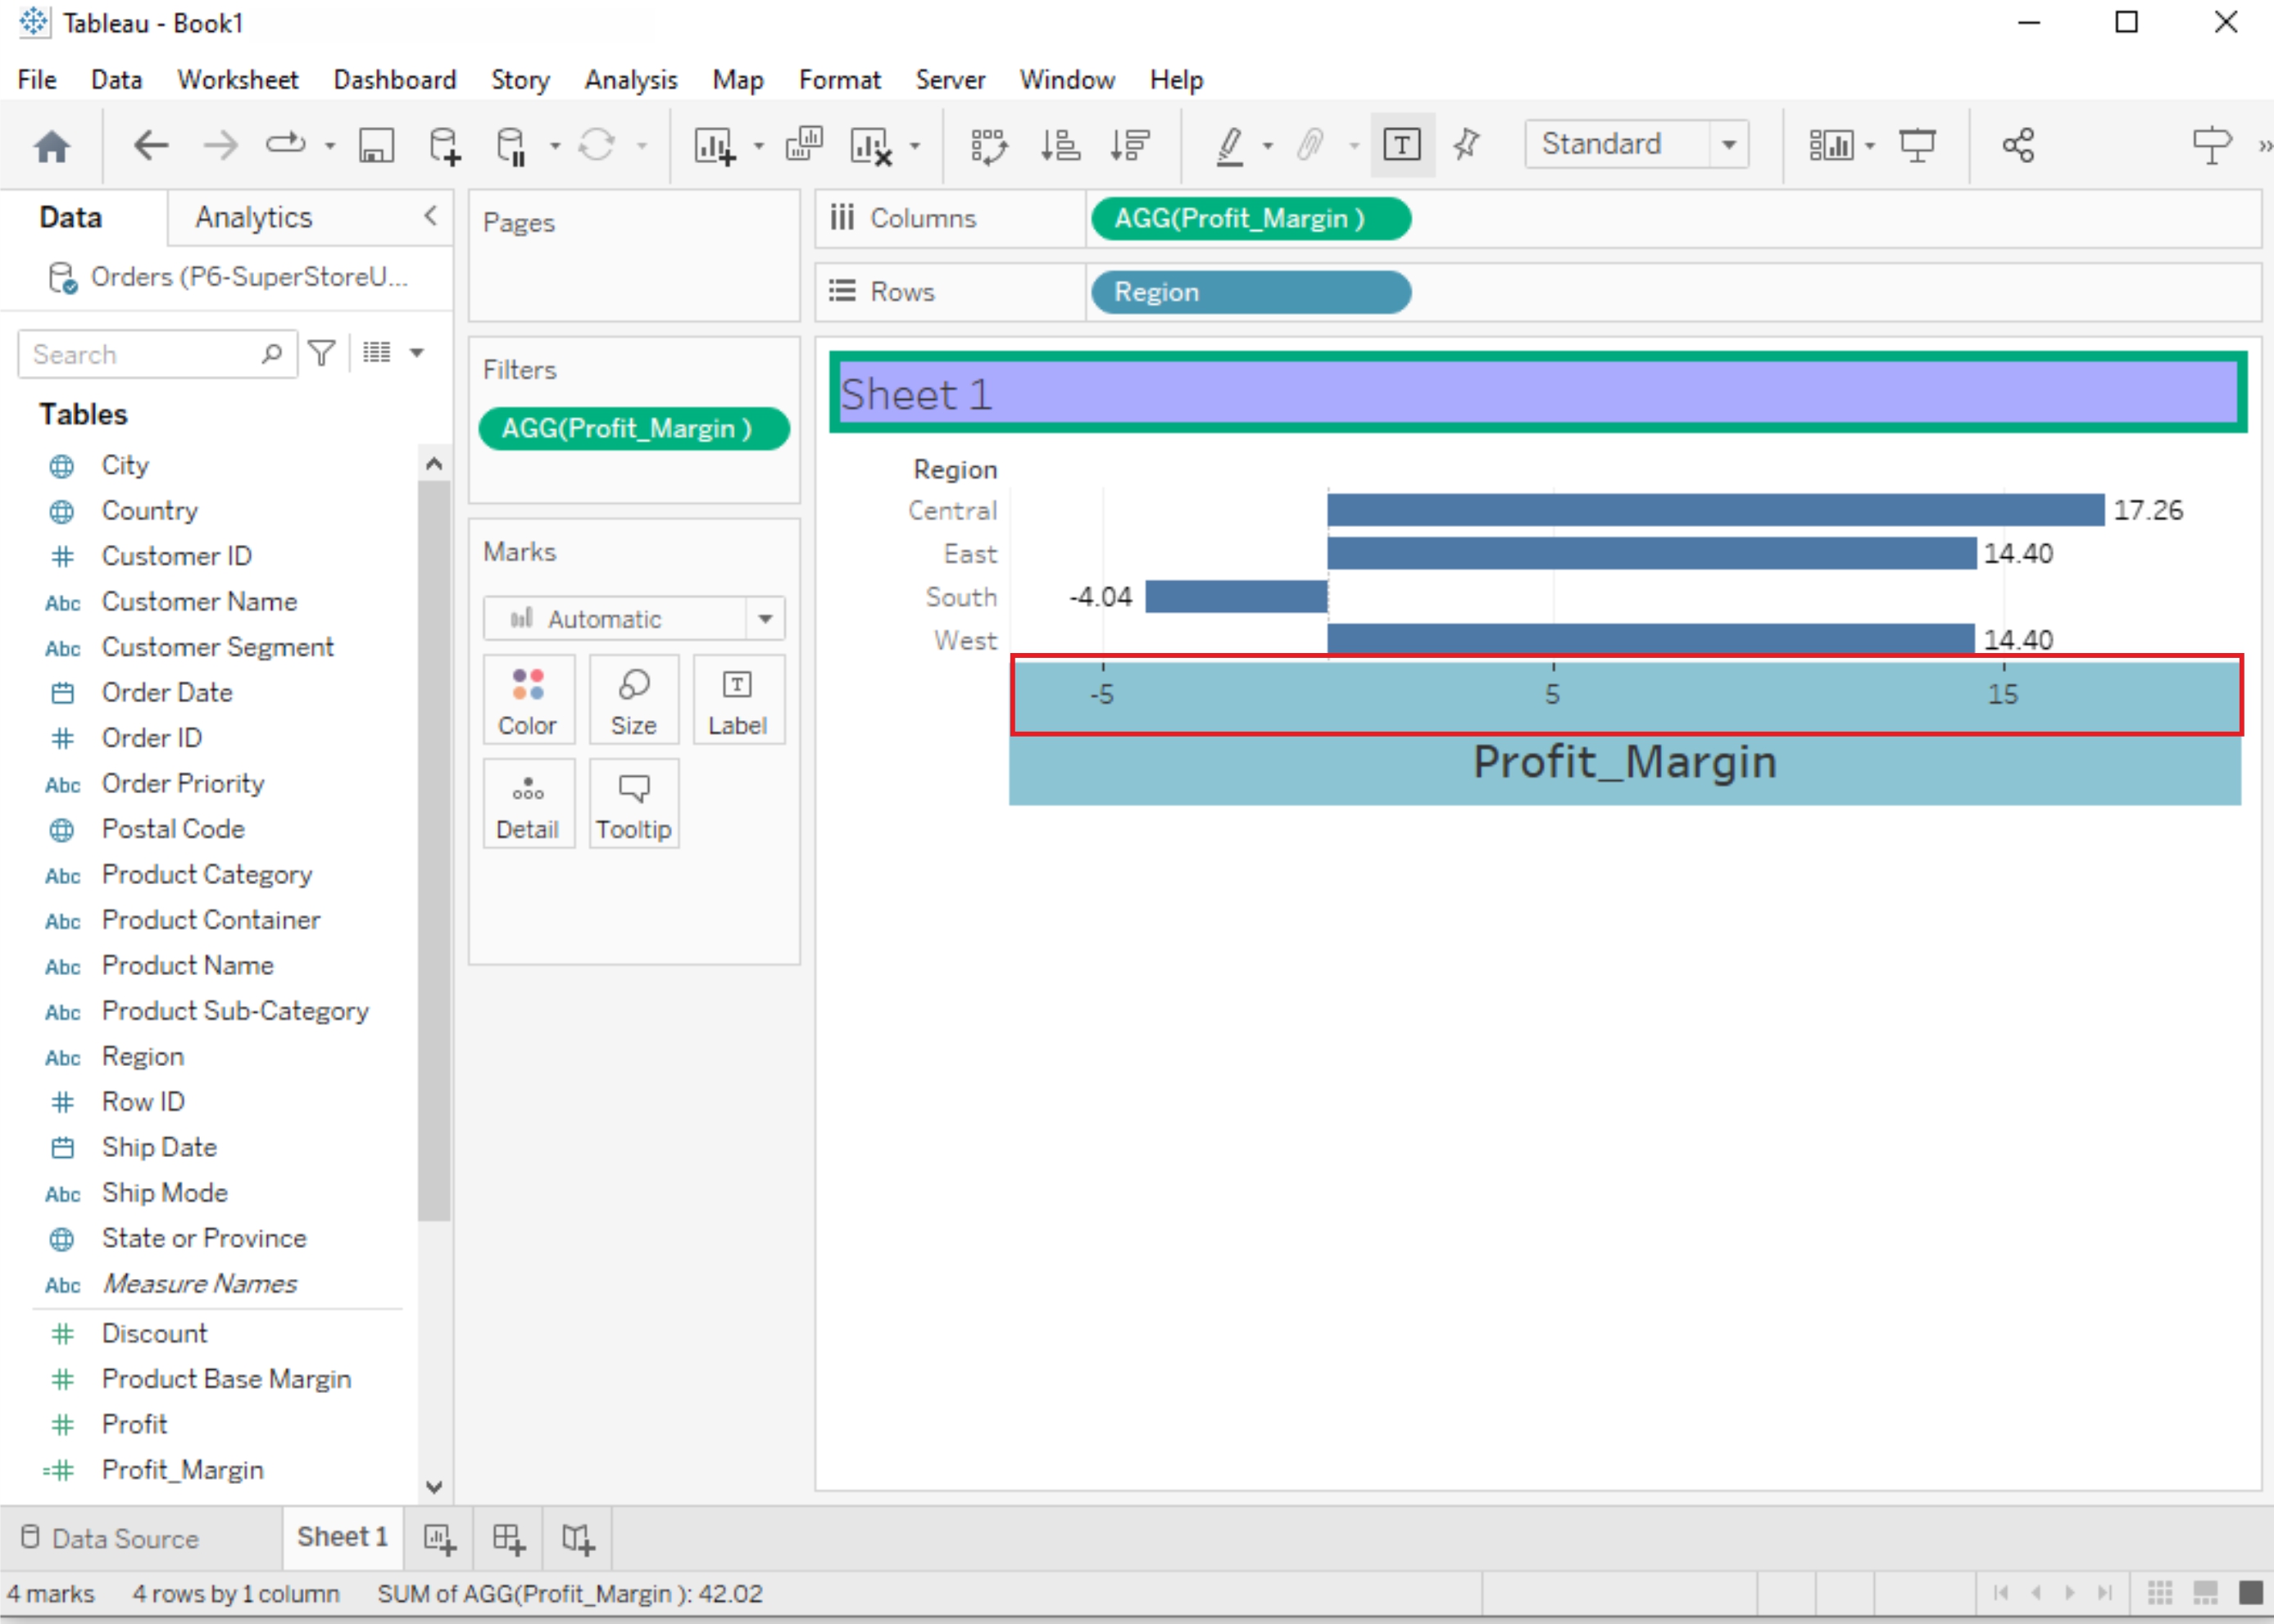
3. Scale and Range:
- To change the scale or range of an axis, right-click on it and select "Edit Axis."
- In the dialog box, adjust the Minimum and Maximum values, scale, or range according to your needs.
Manipulating Data in Tableau data
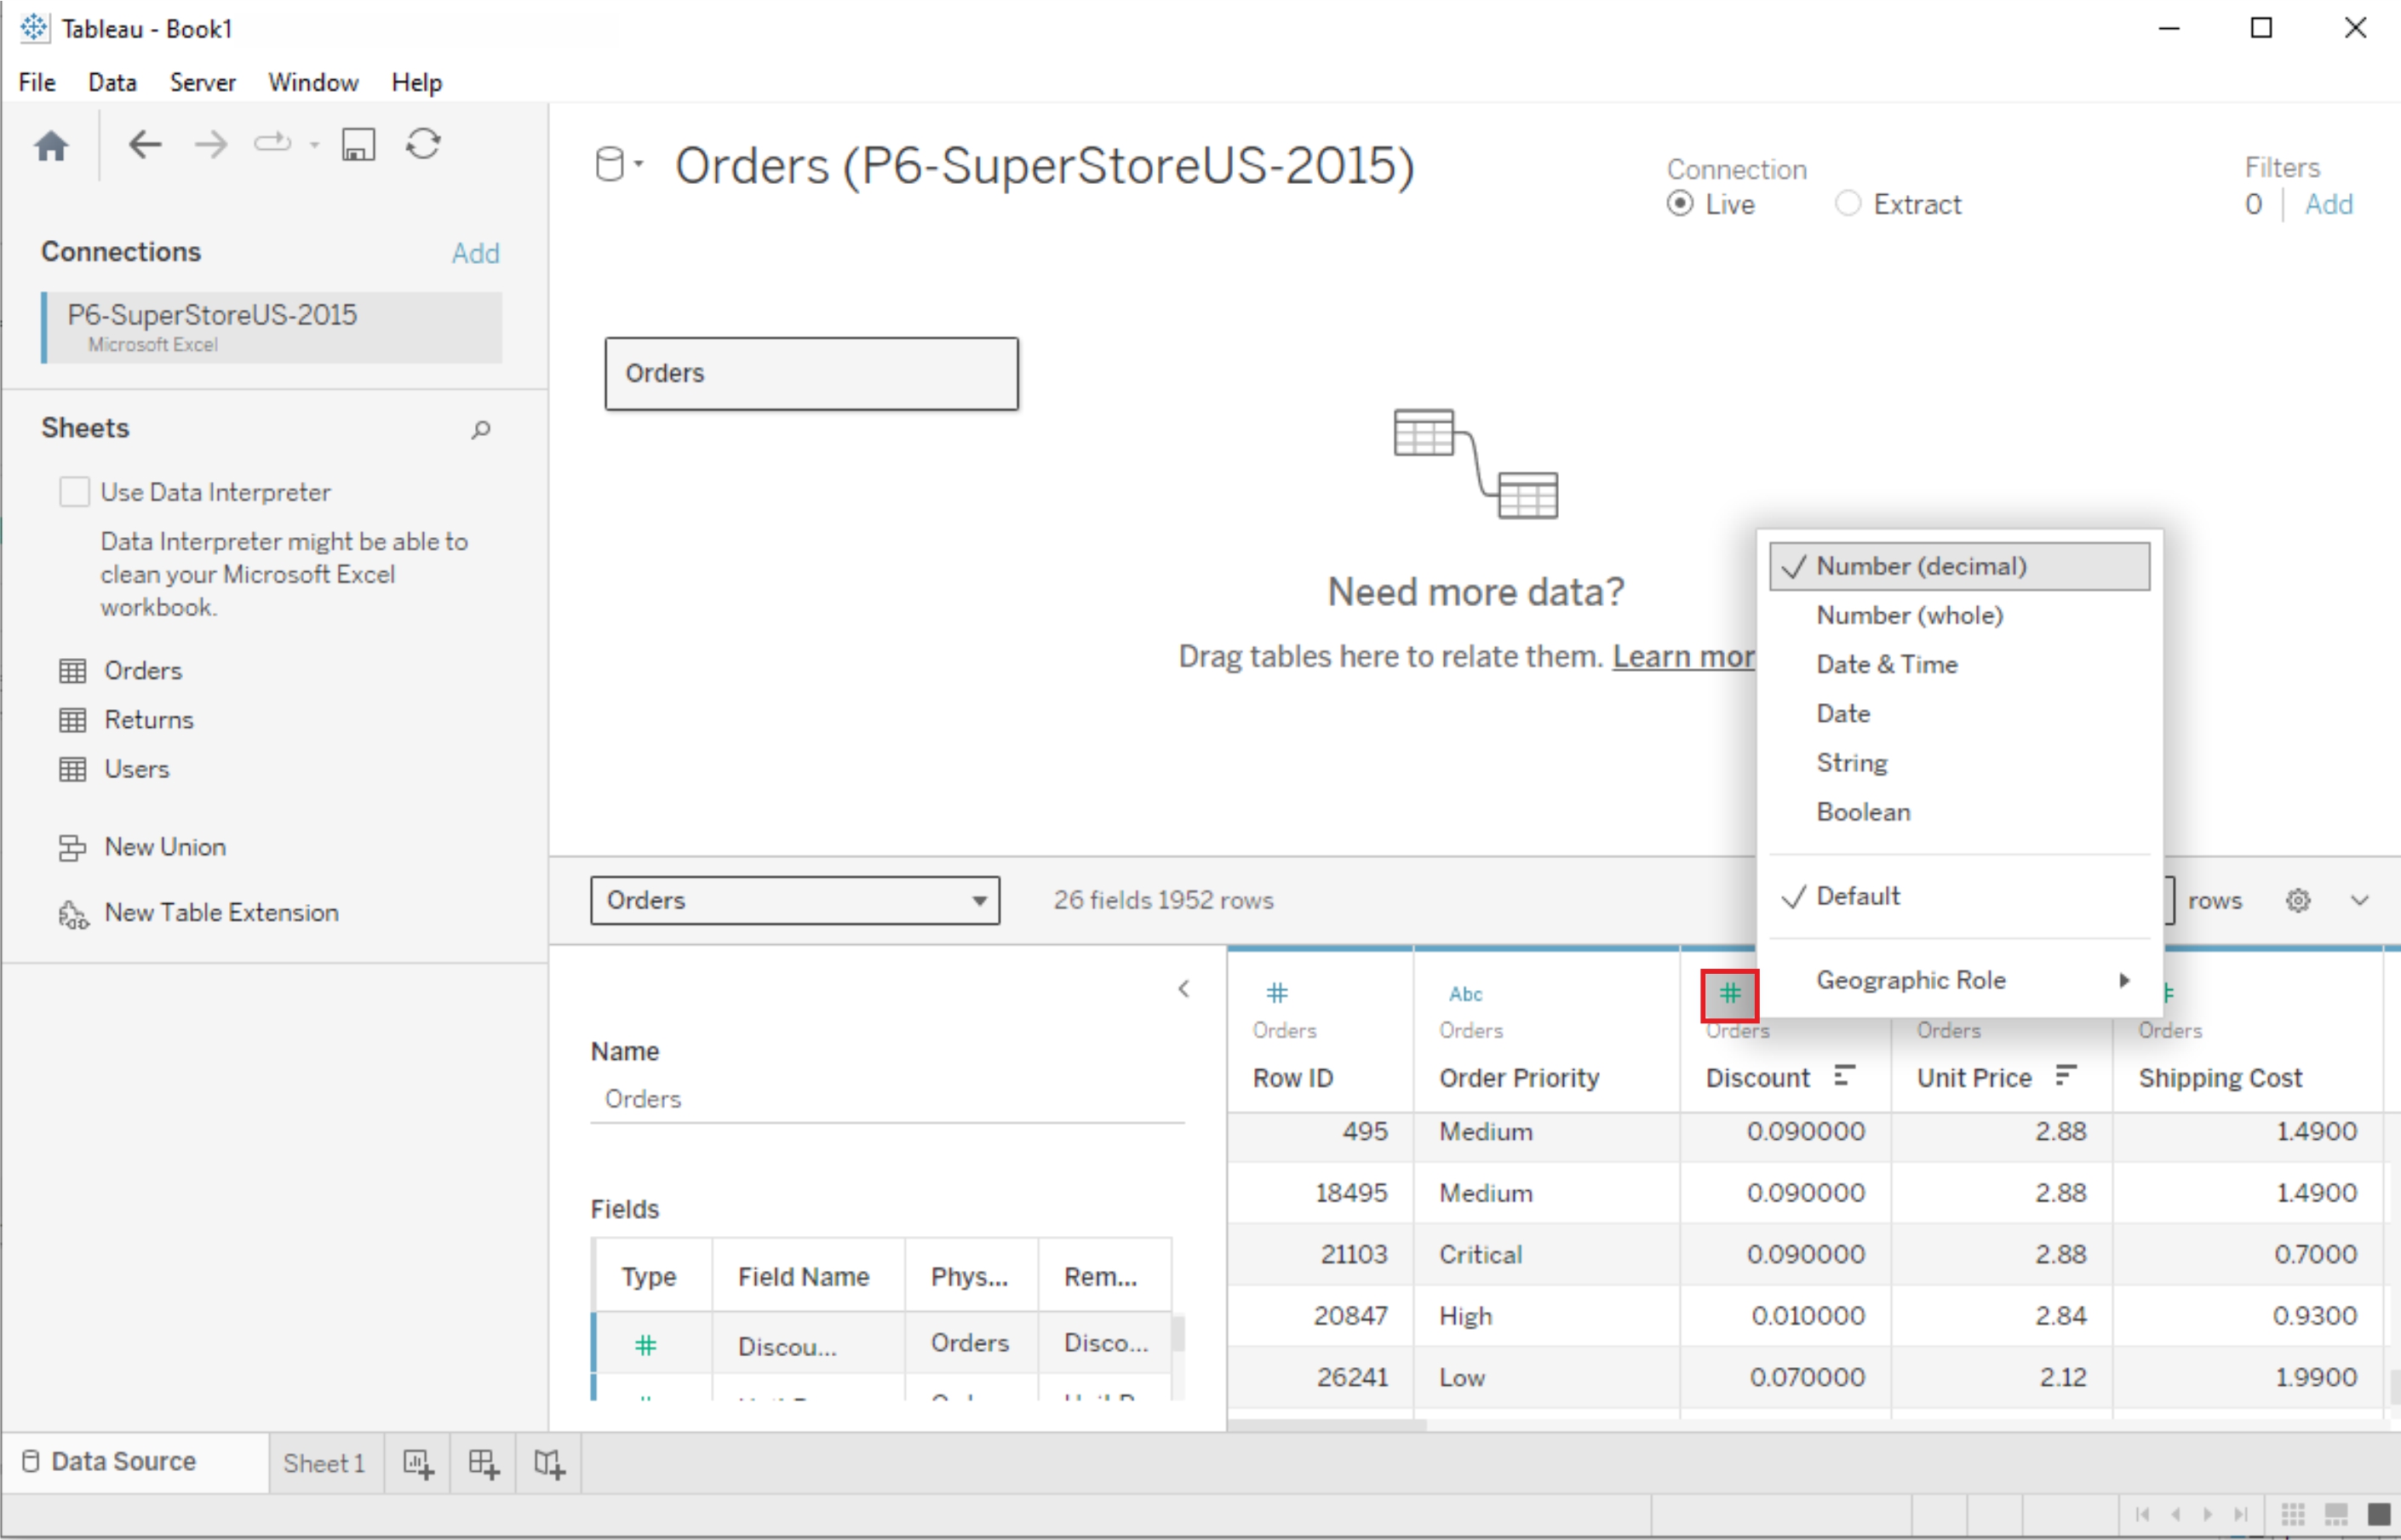
Change Data Type
If Tableau has inferred a wrong data type for a column, the data type can be changed by clicking on the data type symbol in the column header
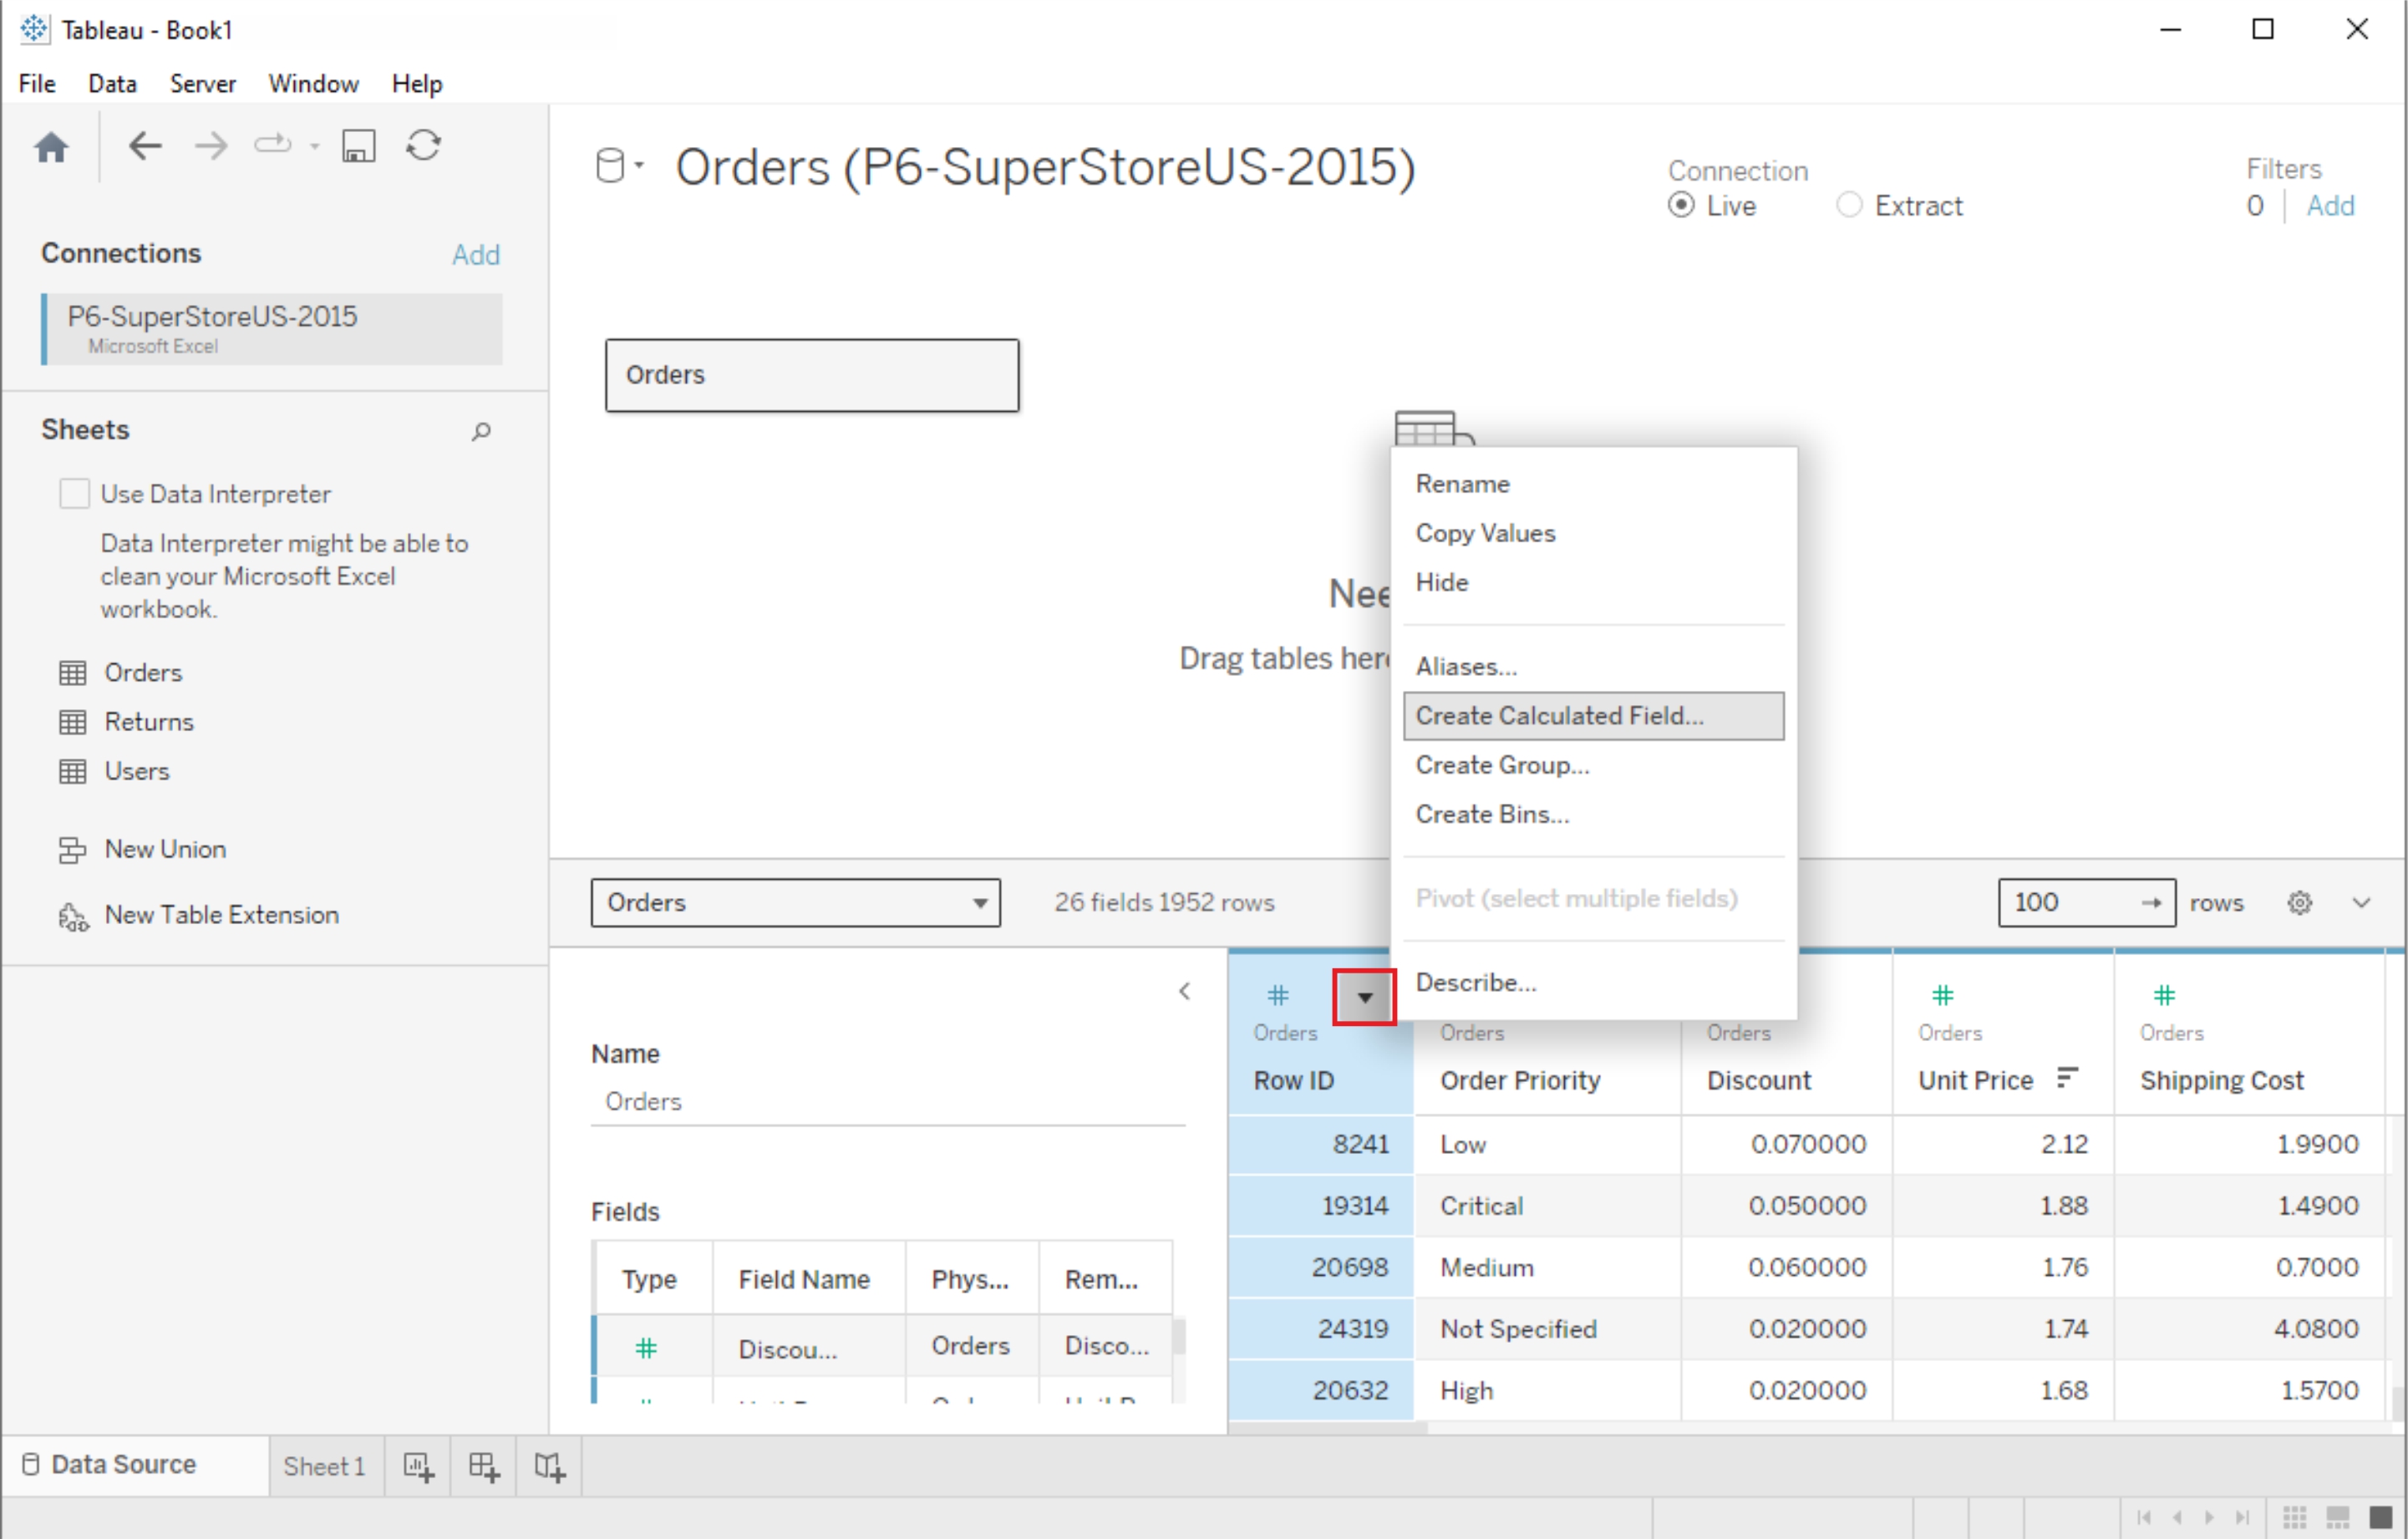
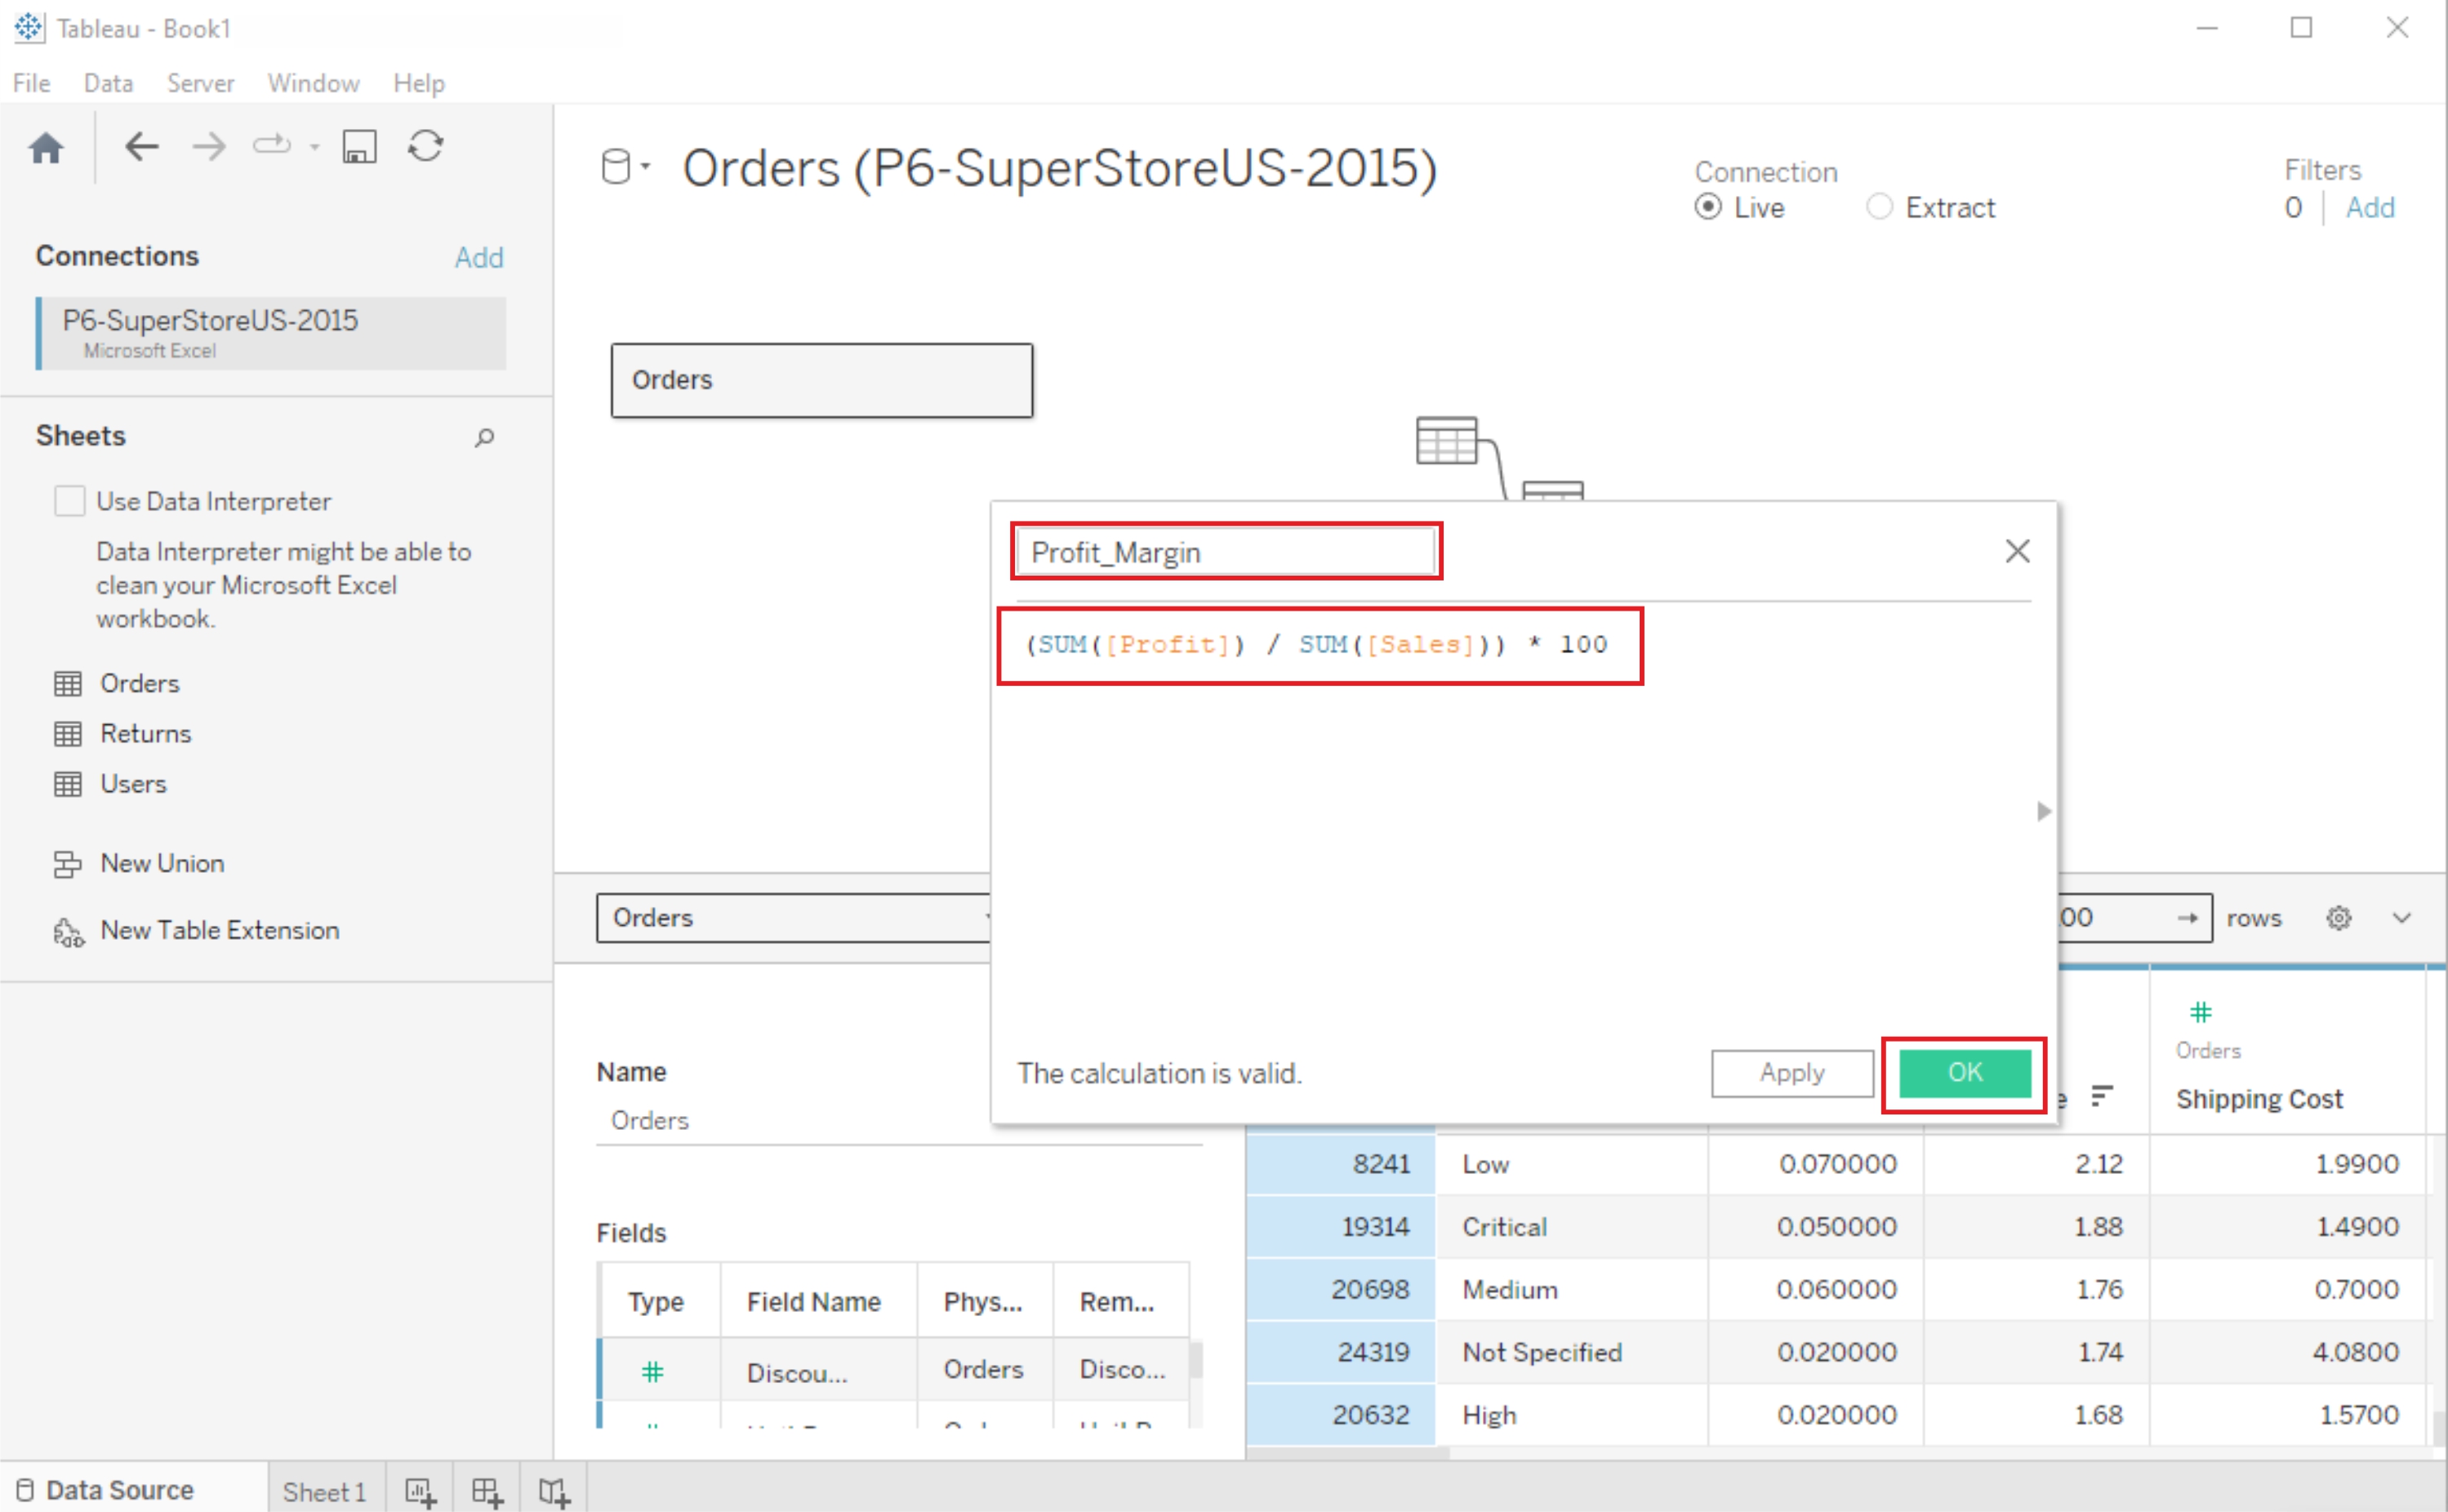
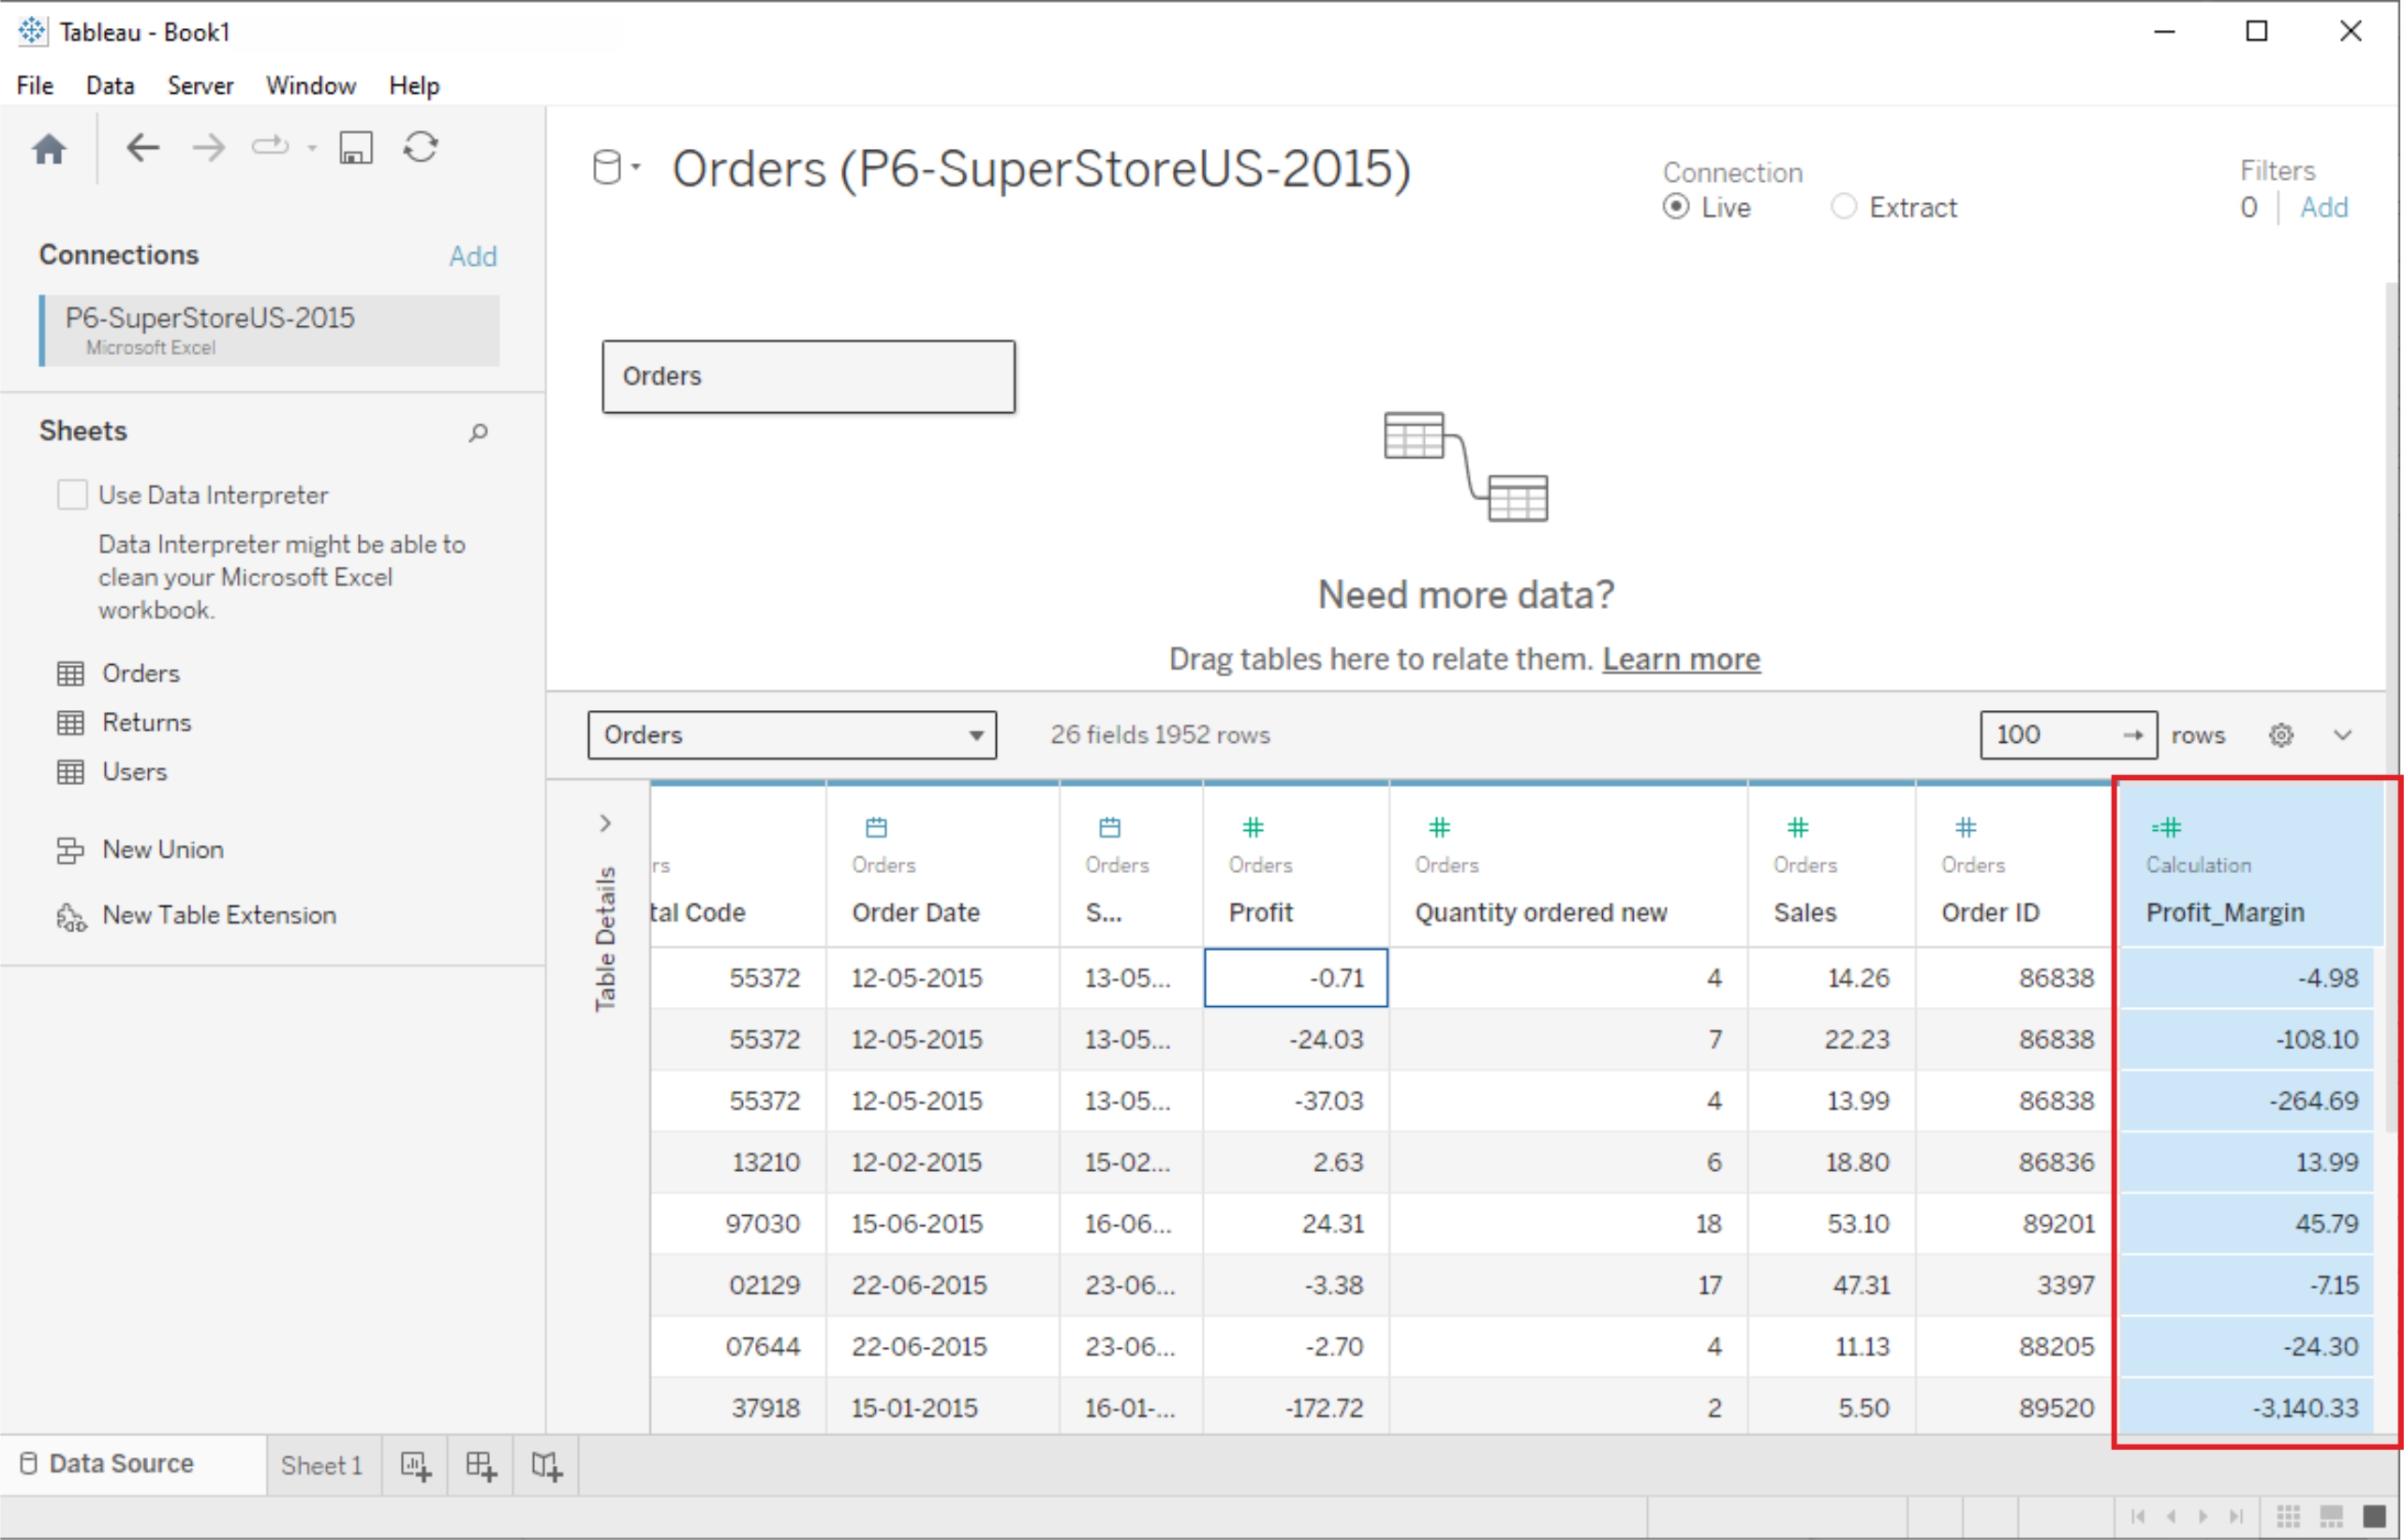
New Column(Calculated Fields)
Calculated fields can be used if you need to create customized logic for manipulating certain data types or data values. There are a large-range of functions available in Tableau that can used individually or collectively for data manipulation
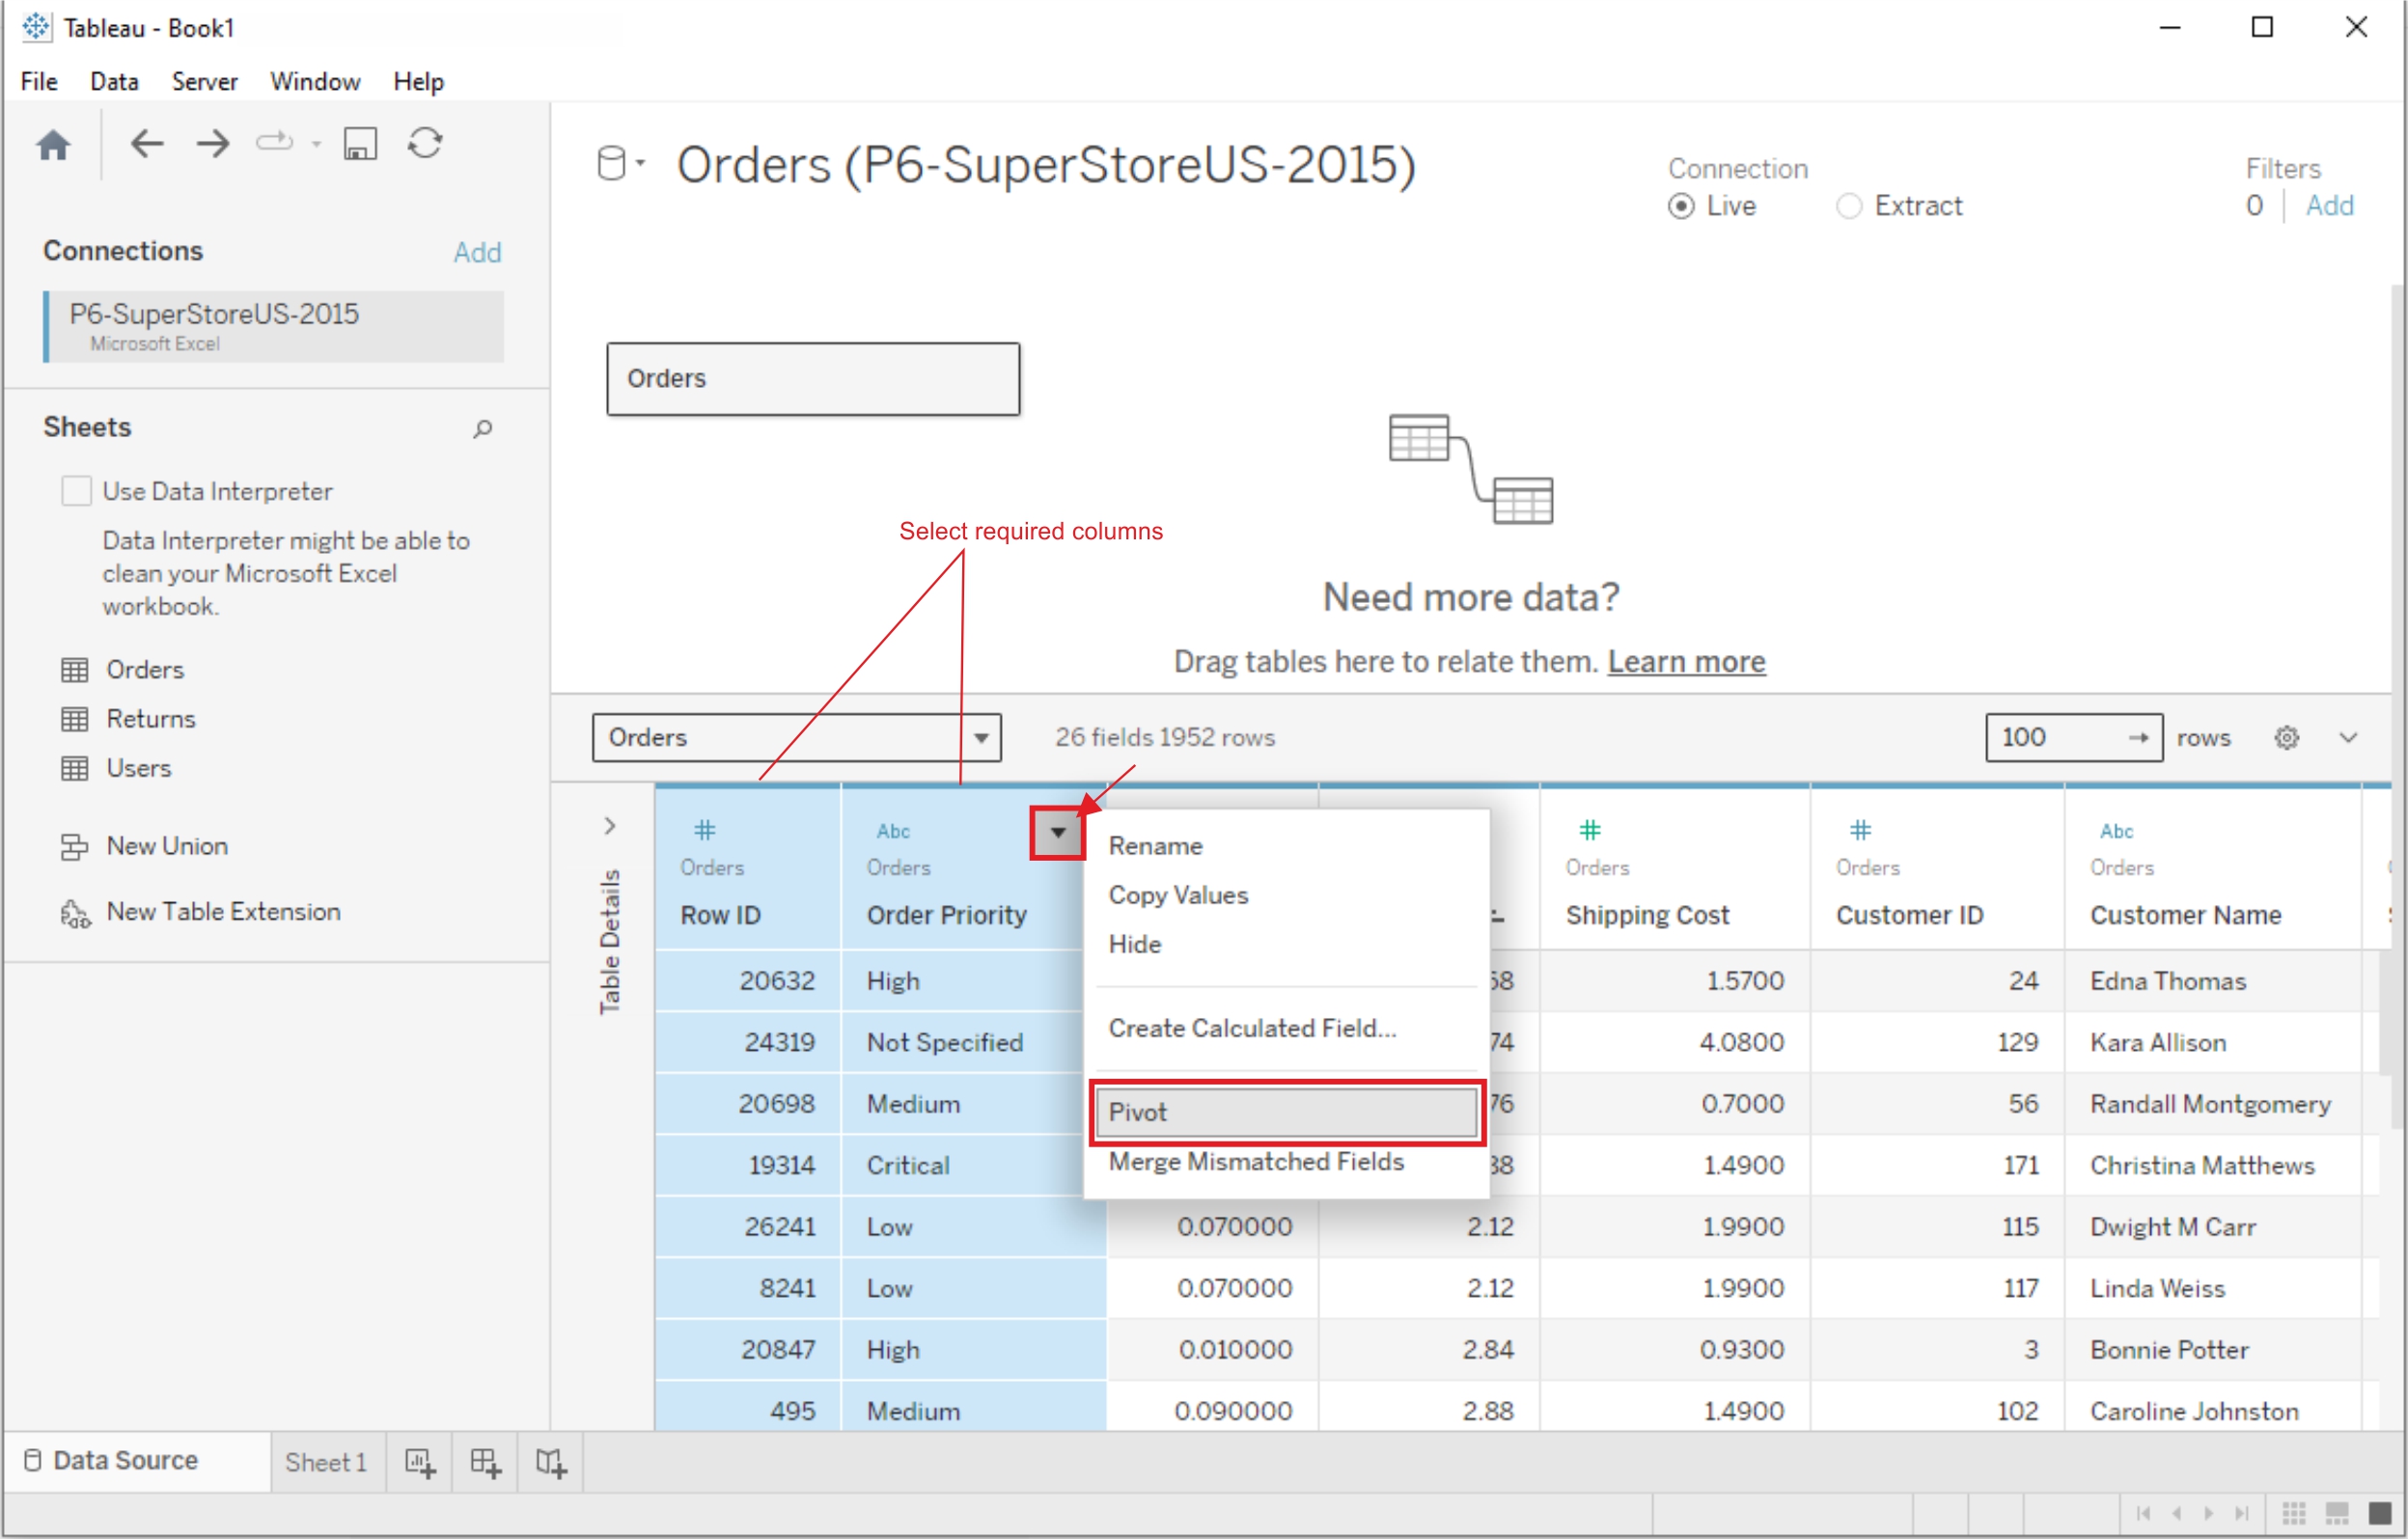
Pivoting Tableau data
Data pivoting enables you to rearrange the columns and rows in a report so you can view data from different perspectives
Related Content :
Power BI Lab Programs
1) Understanding Data, What is data, where to find data, Foundations for building Data Visualizations,Creating Your First visualization? View Solution
2) Getting started with Tableau Software using Data file formats, connecting your Data to Tableau,creating basic charts(line, bar charts, Tree maps),Using the Show me panel. View Solution
3) Tableau Calculations, Overview of SUM, AVR, and Aggregate features, Creating custom calculationsand fields View Solution
4) Applying new data calculations to your visualizations, Formatting Visualizations, Formatting Toolsand Menus, Formatting specific parts of the view. View Solution
5) Editing and Formatting Axes, Manipulating Data in Tableau data, Pivoting Tableau data. View Solution
6) Structuring your data, Sorting and filtering Tableau data, Pivoting Tableau data. View Solution
7) Advanced Visualization Tools: Using Filters, Using the Detail panel, using the Size panels, customizing filters, Using and Customizing tooltips, Formatting your data with colors. View Solution
8) Creating Dashboards & Storytelling, creating your first dashboard and Story, Design for differentdisplays, adding interactivity to your Dashboard, Distributing & Publishing your Visualization. View Solution
9) Tableau file types, publishing to Tableau Online, Sharing your visualizations, printing, and Exporting. View Solution
10) Creating custom charts, cyclical data and circular area charts, Dual Axis charts. View Solution