SKILL DEVELOPMENT COURSE - (DATA VISUALIZATION - R PROGRAMMING/ POWER BI)
Aim:
Tableau Calculations, Overview of SUM, AVR, and Aggregate features, Creating custom calculationsand fields
Solution :
Tableau offers a powerful set of calculation tools that allow you to manipulate, transform, and analyze your data in various ways. Here's an overview of some key concepts related to Tableau calculations, including SUM, AVG (average), and aggregate functions, as well as creating custom calculations and fields
SUM and AVG (Average) Functions
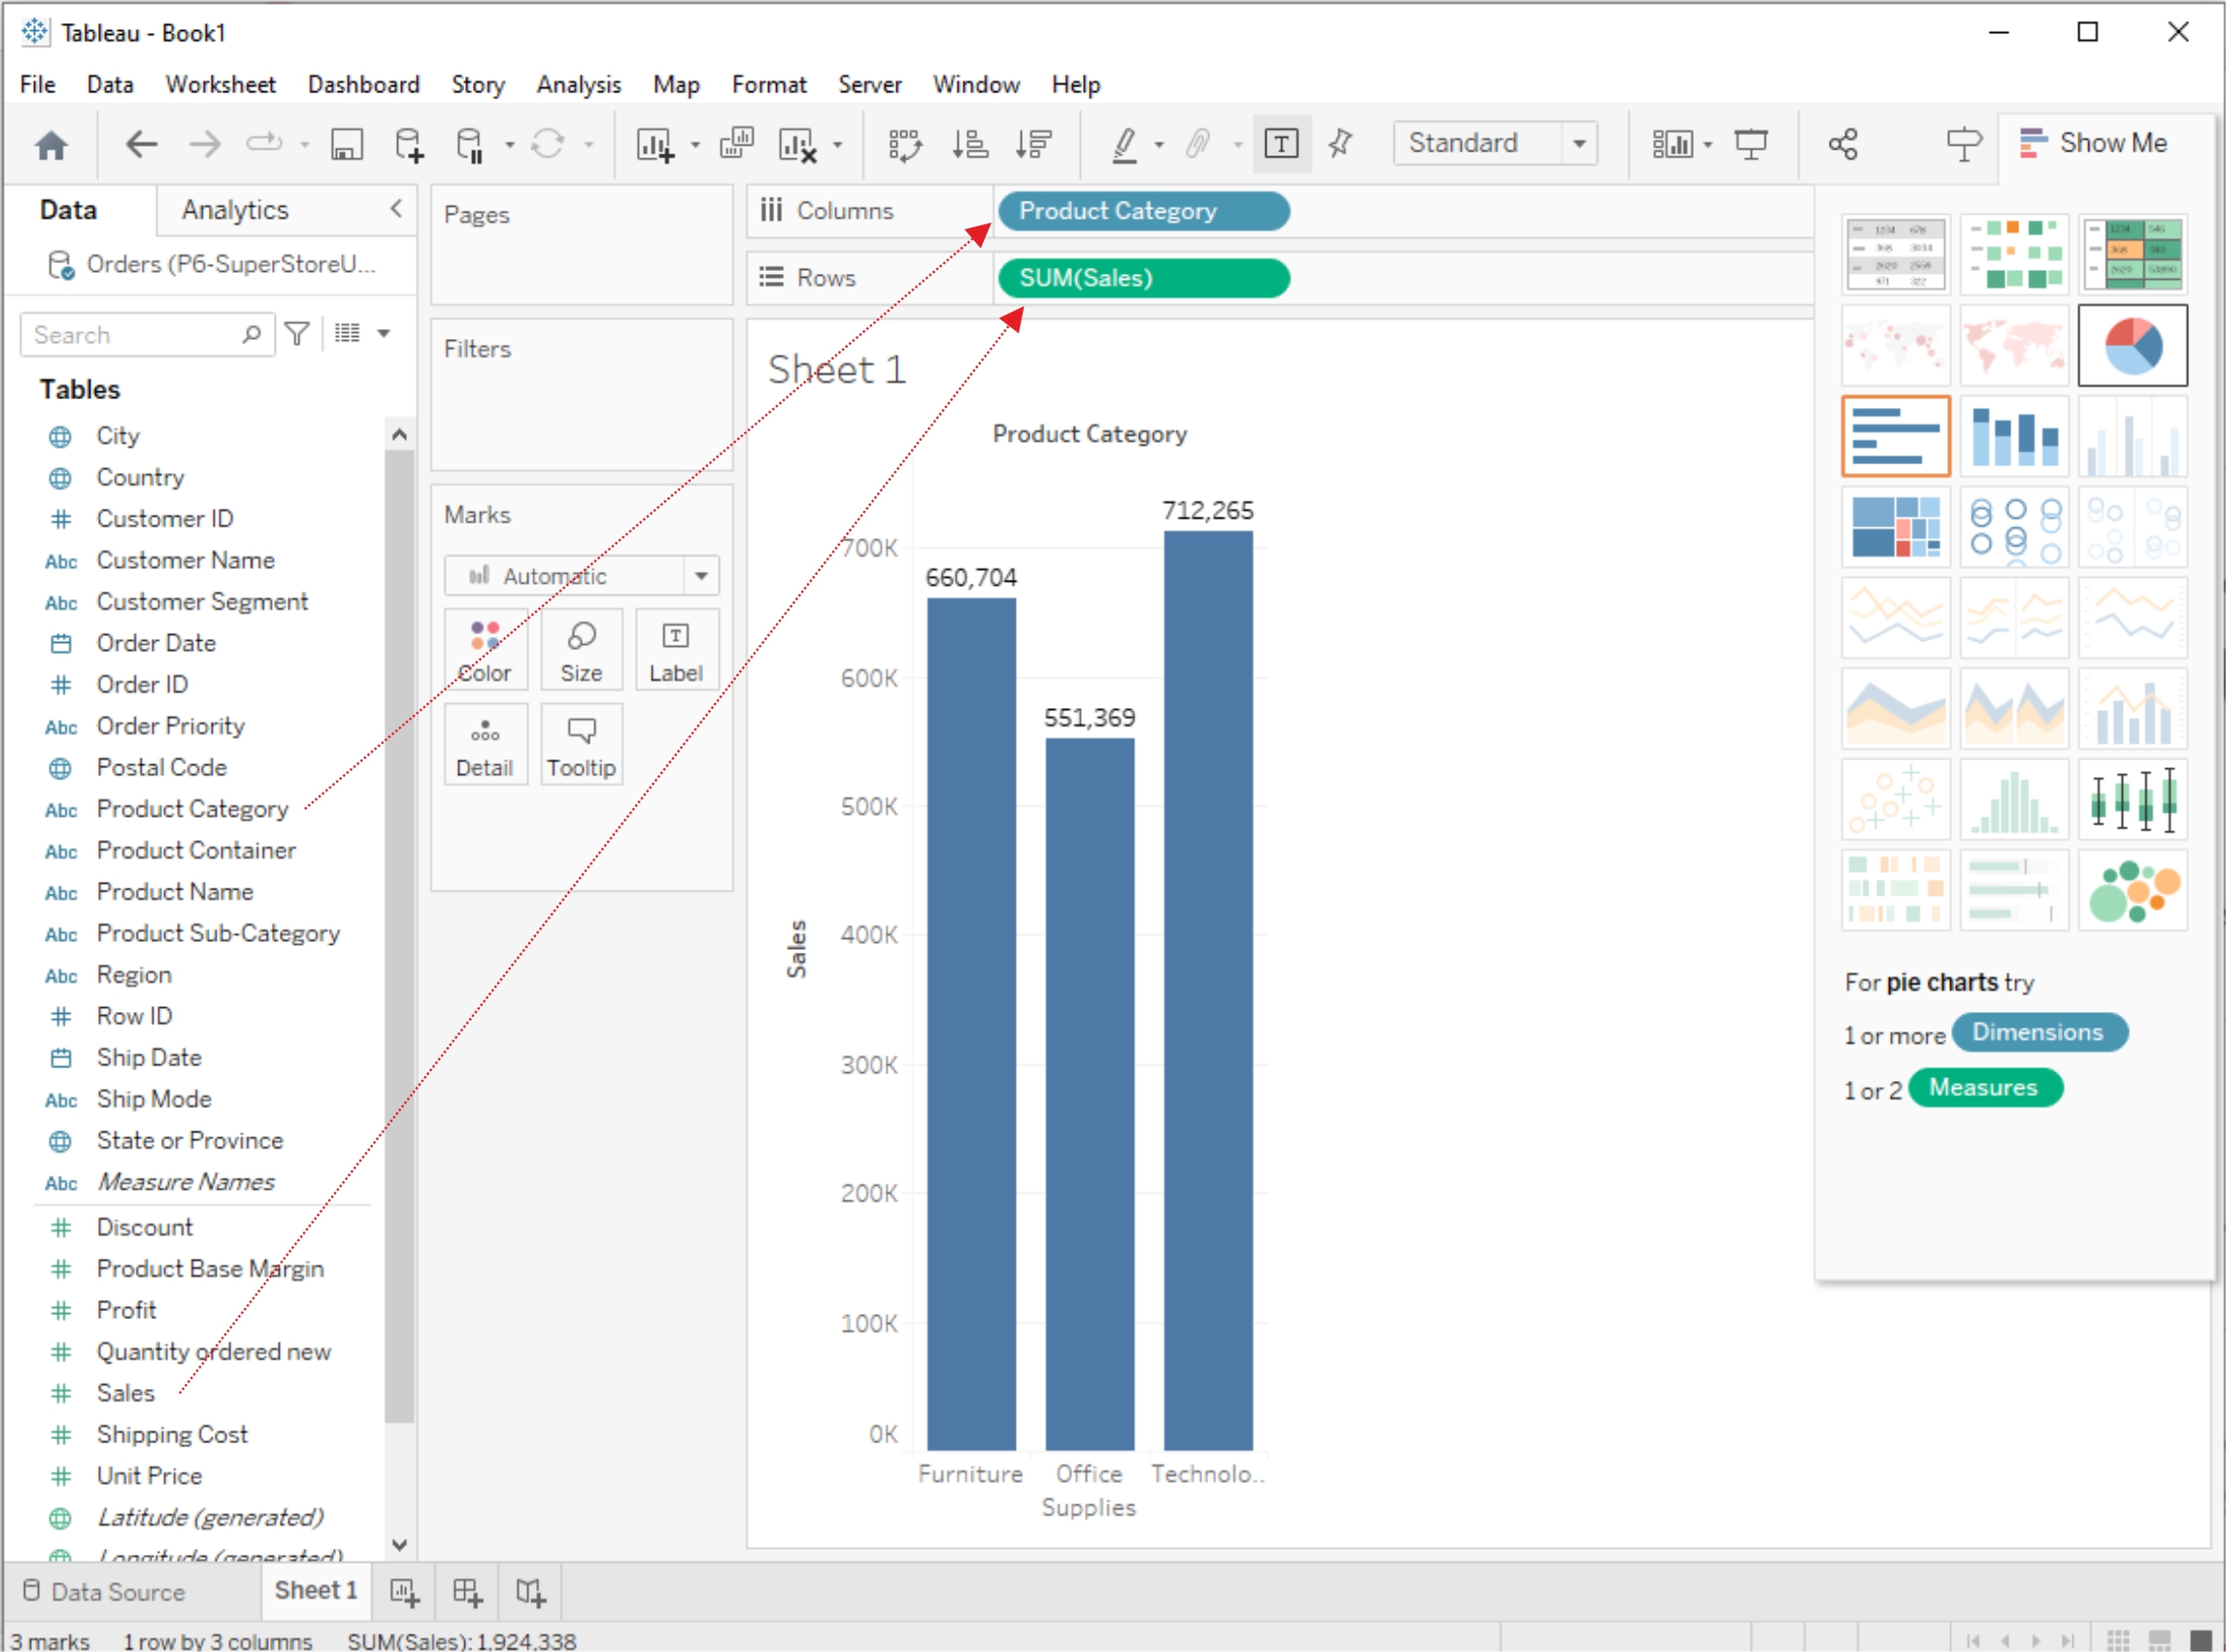
SUM Function
The SUM function in Tableau calculates the total sum of a numeric field. You can use it to find the sum of values in a column or as part of a more complex calculation. To use SUM, simply drag and drop a numeric field into the "SUM" shelf, or you can create a calculated field using the SUM function.
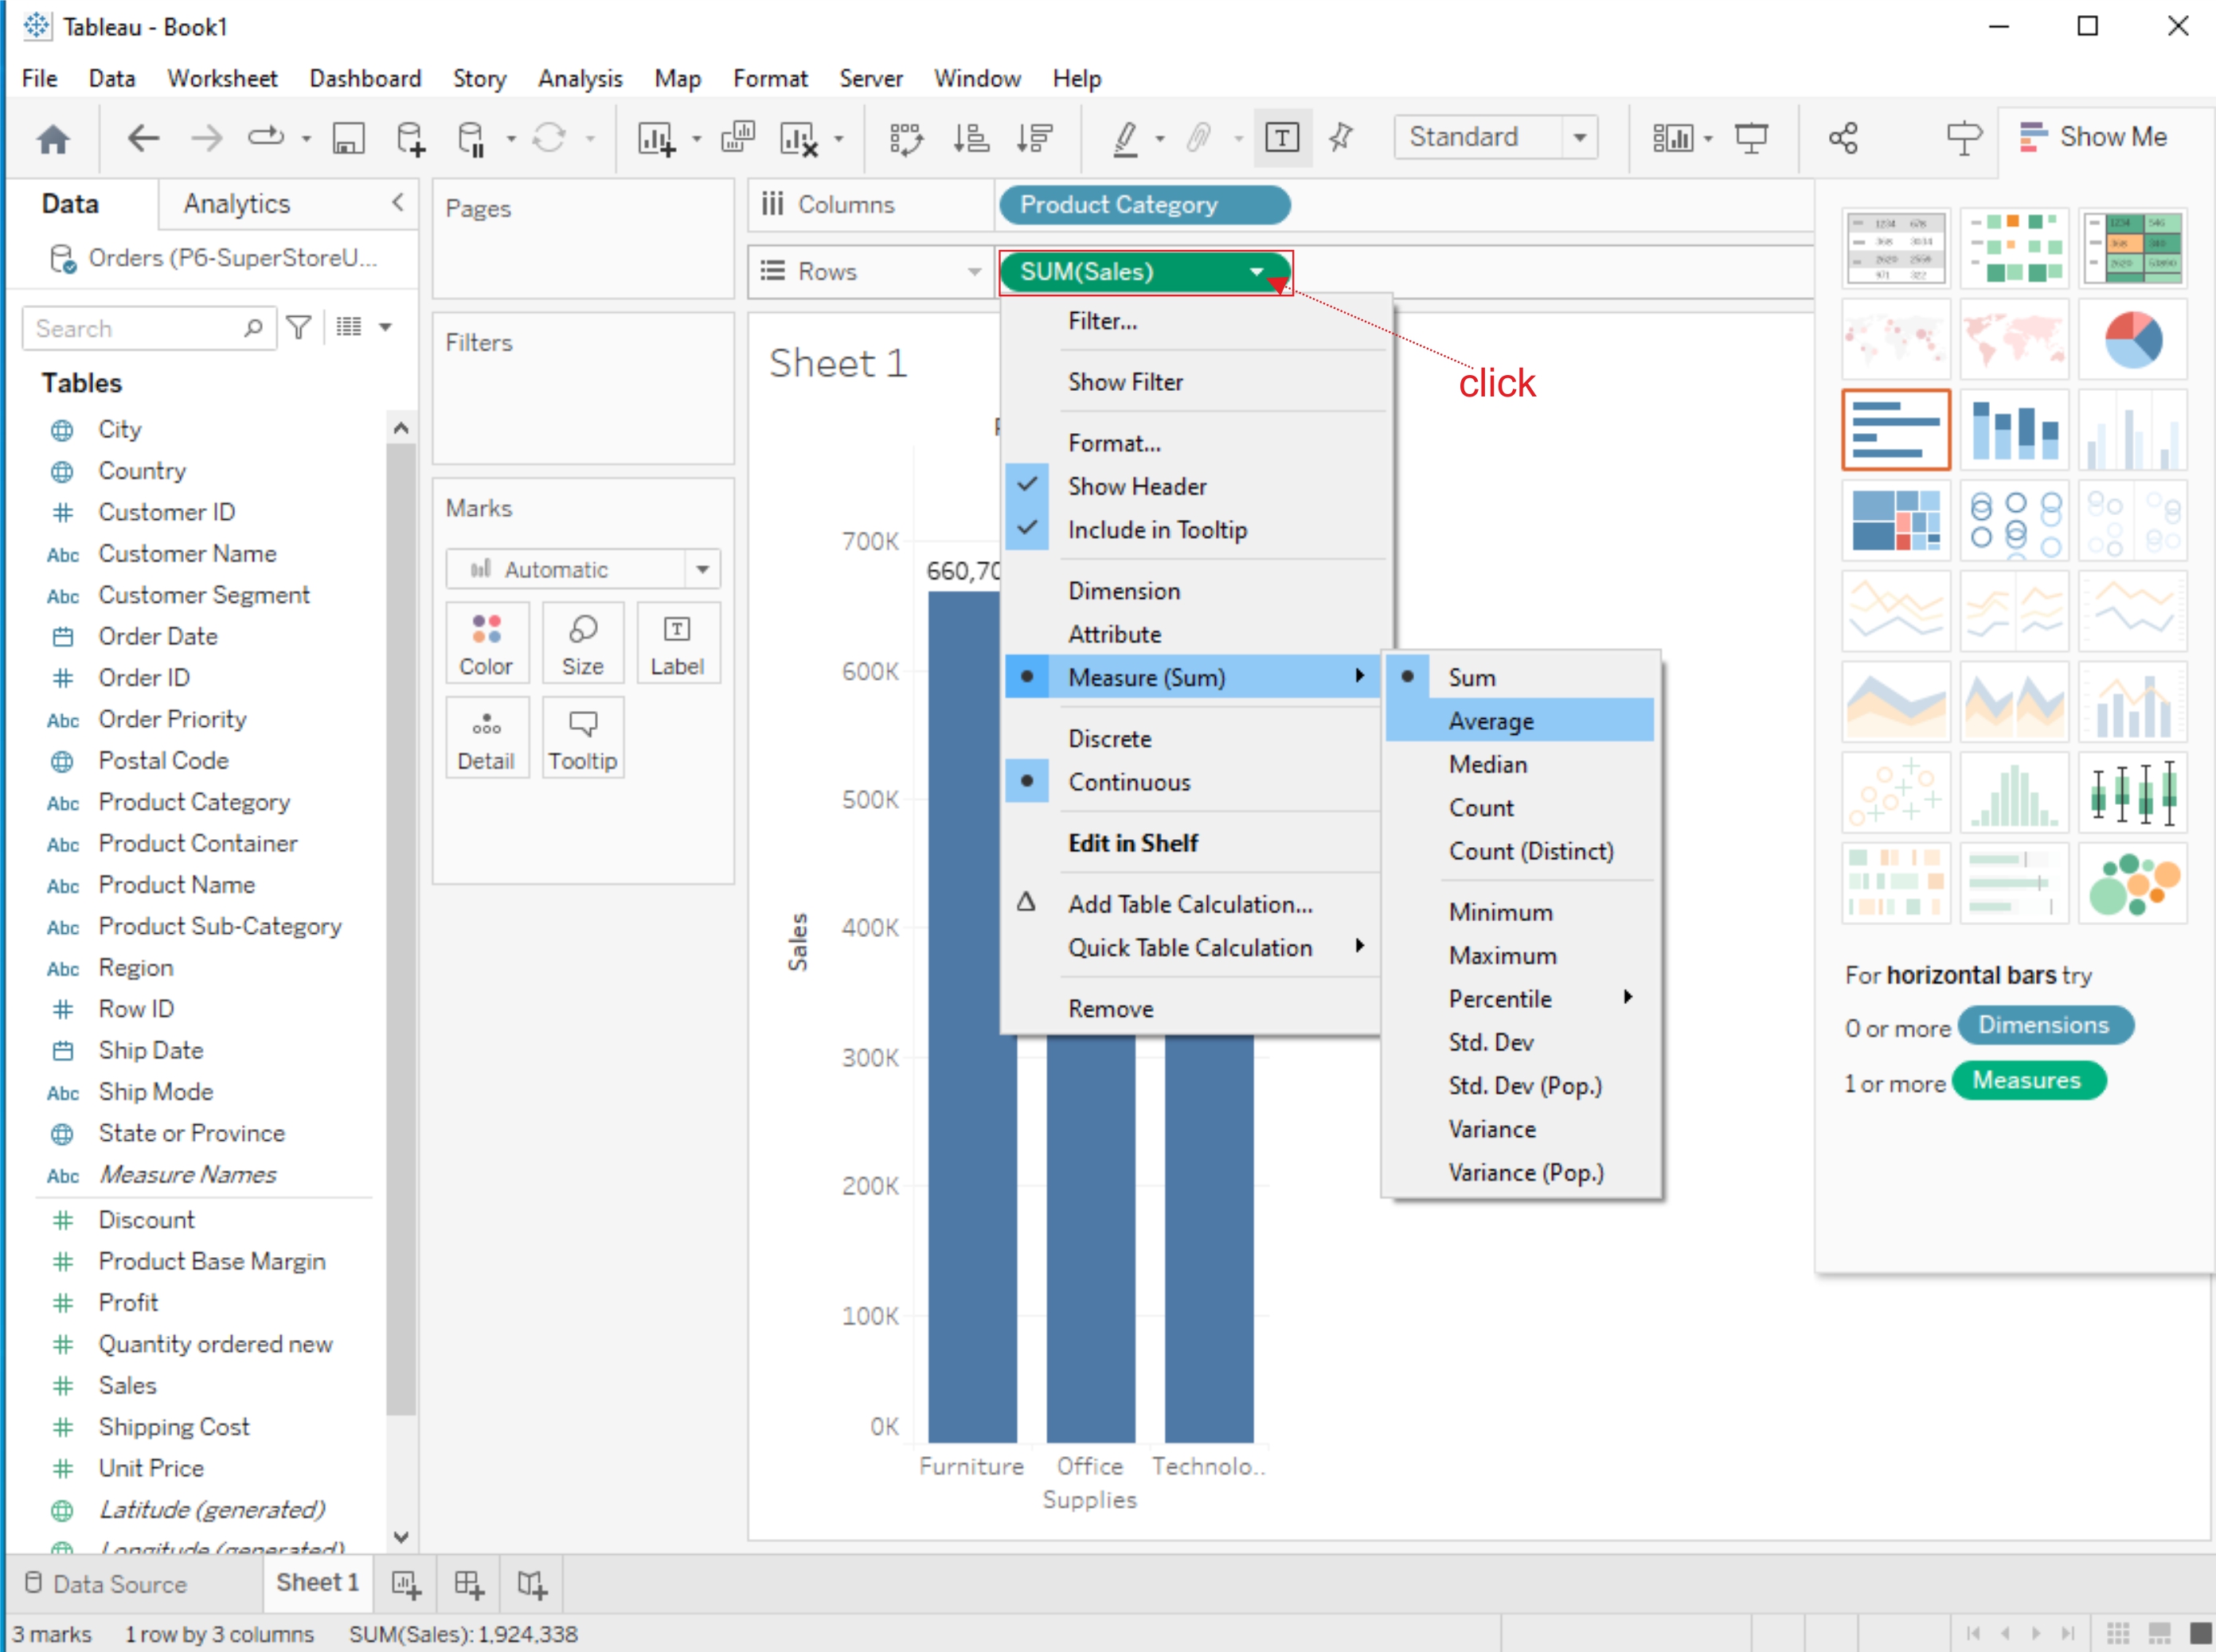
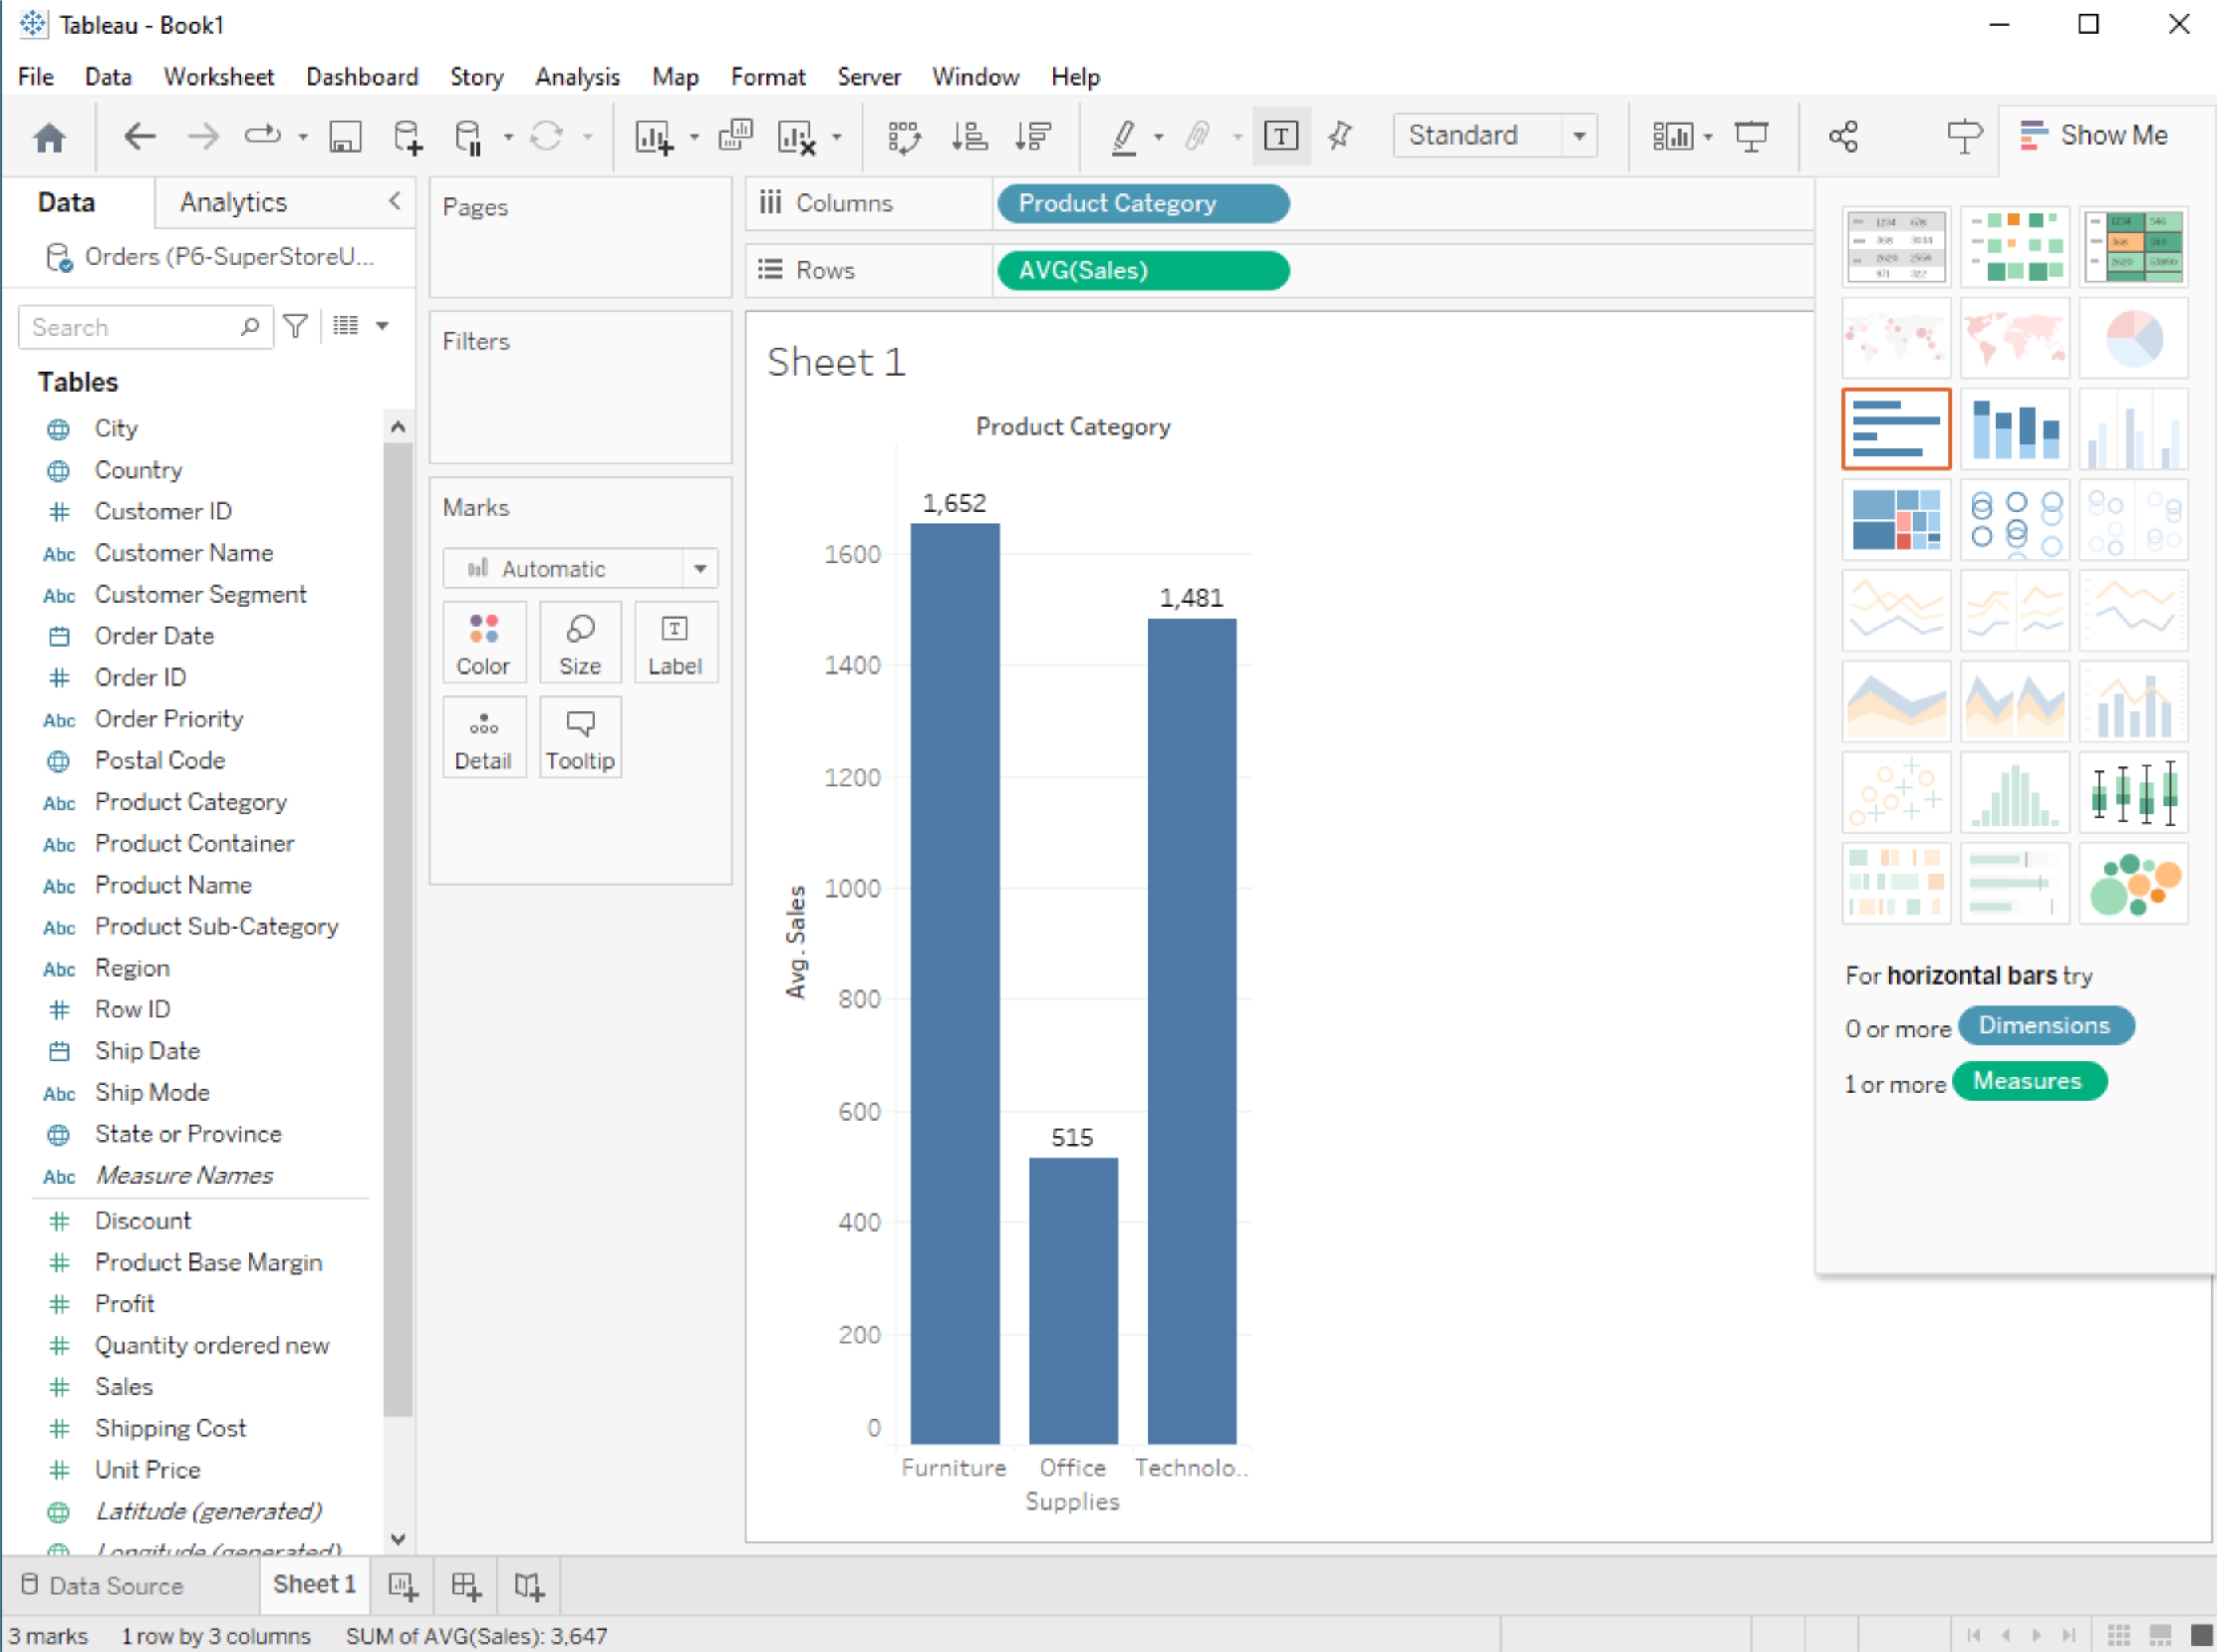
AVG (Average) Function
The AVG function calculates the average (mean) value of a numeric field. Like SUM, you can use it by dragging a numeric field into the "AVG" shelf or creating a calculated field with the AVG function.
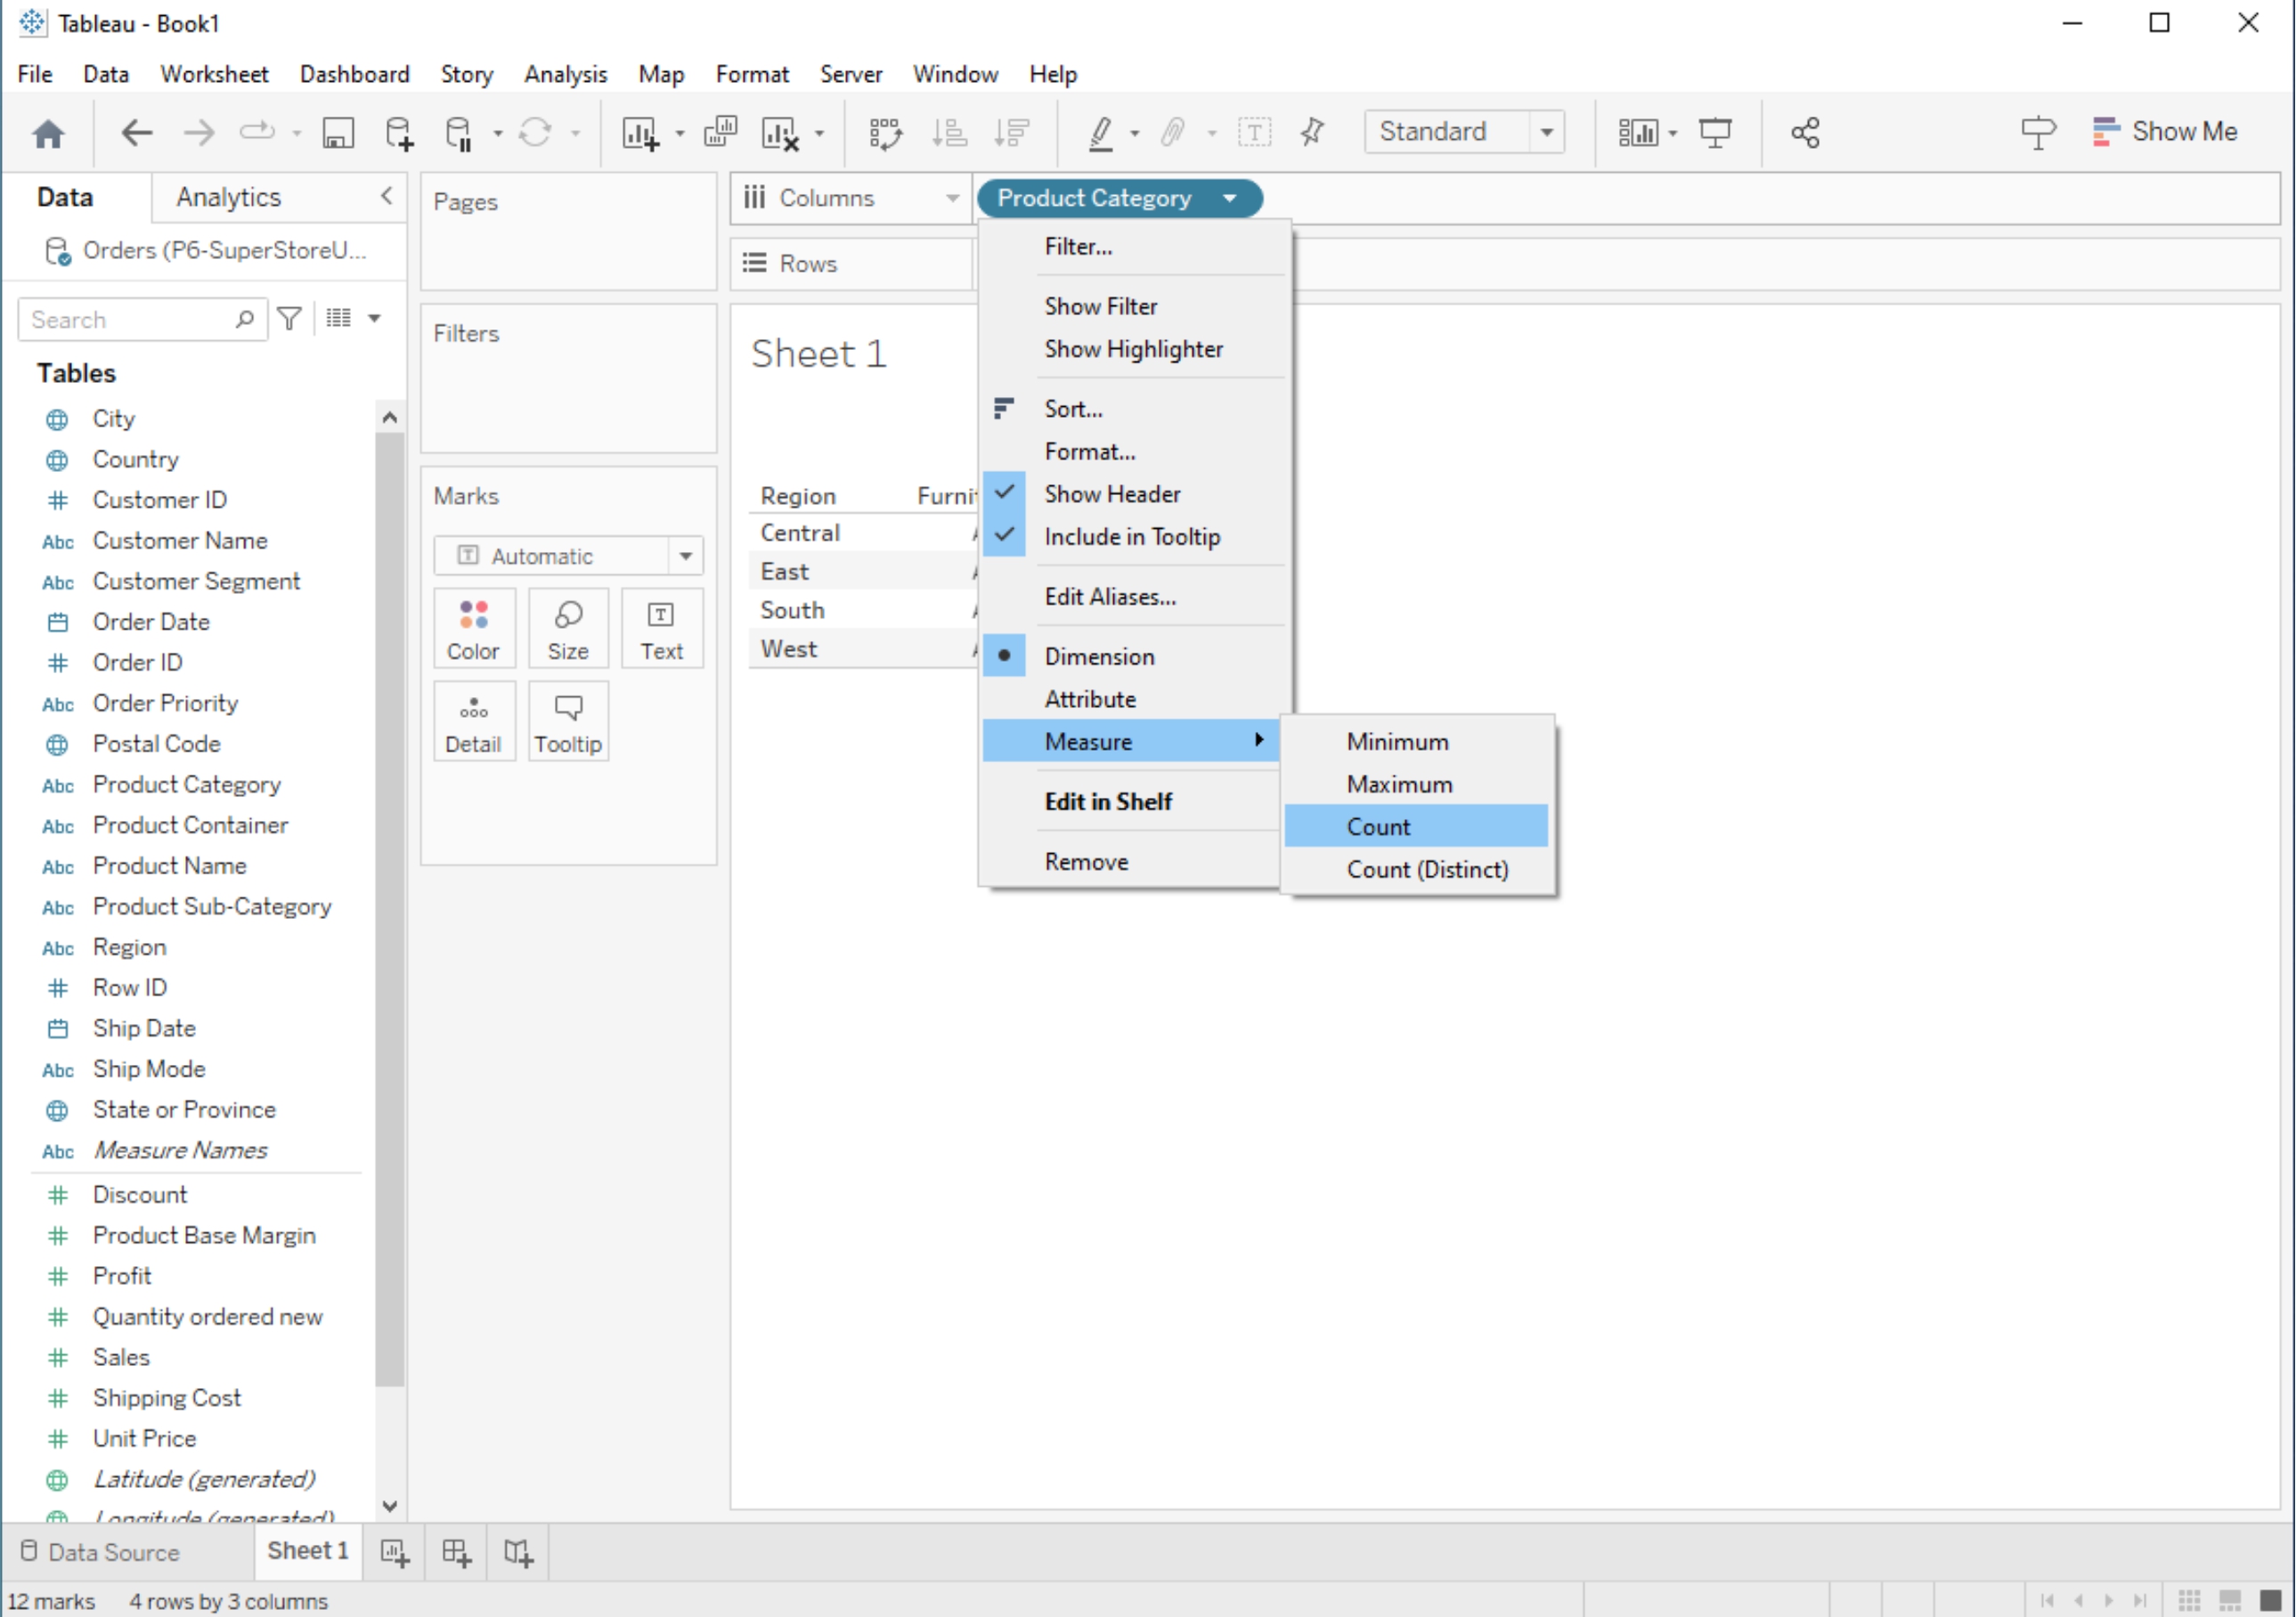
Aggregate Functions:
Tableau provides a range of aggregate functions that allow you to perform calculations on groups of data. Common aggregate functions include SUM, AVG, COUNT, MIN (minimum value), and MAX (maximum value). These functions are particularly useful when you want to analyze data at different levels of granularity (e.g., by category, region, or time period).

Creating Custom Calculations
Tableau allows you to create custom calculations using calculated fields. Here's how to create a custom calculation:
1. Create a New Calculated Field
In the Data Source Pane, right-click on your data source and select "Create Calculated Field".
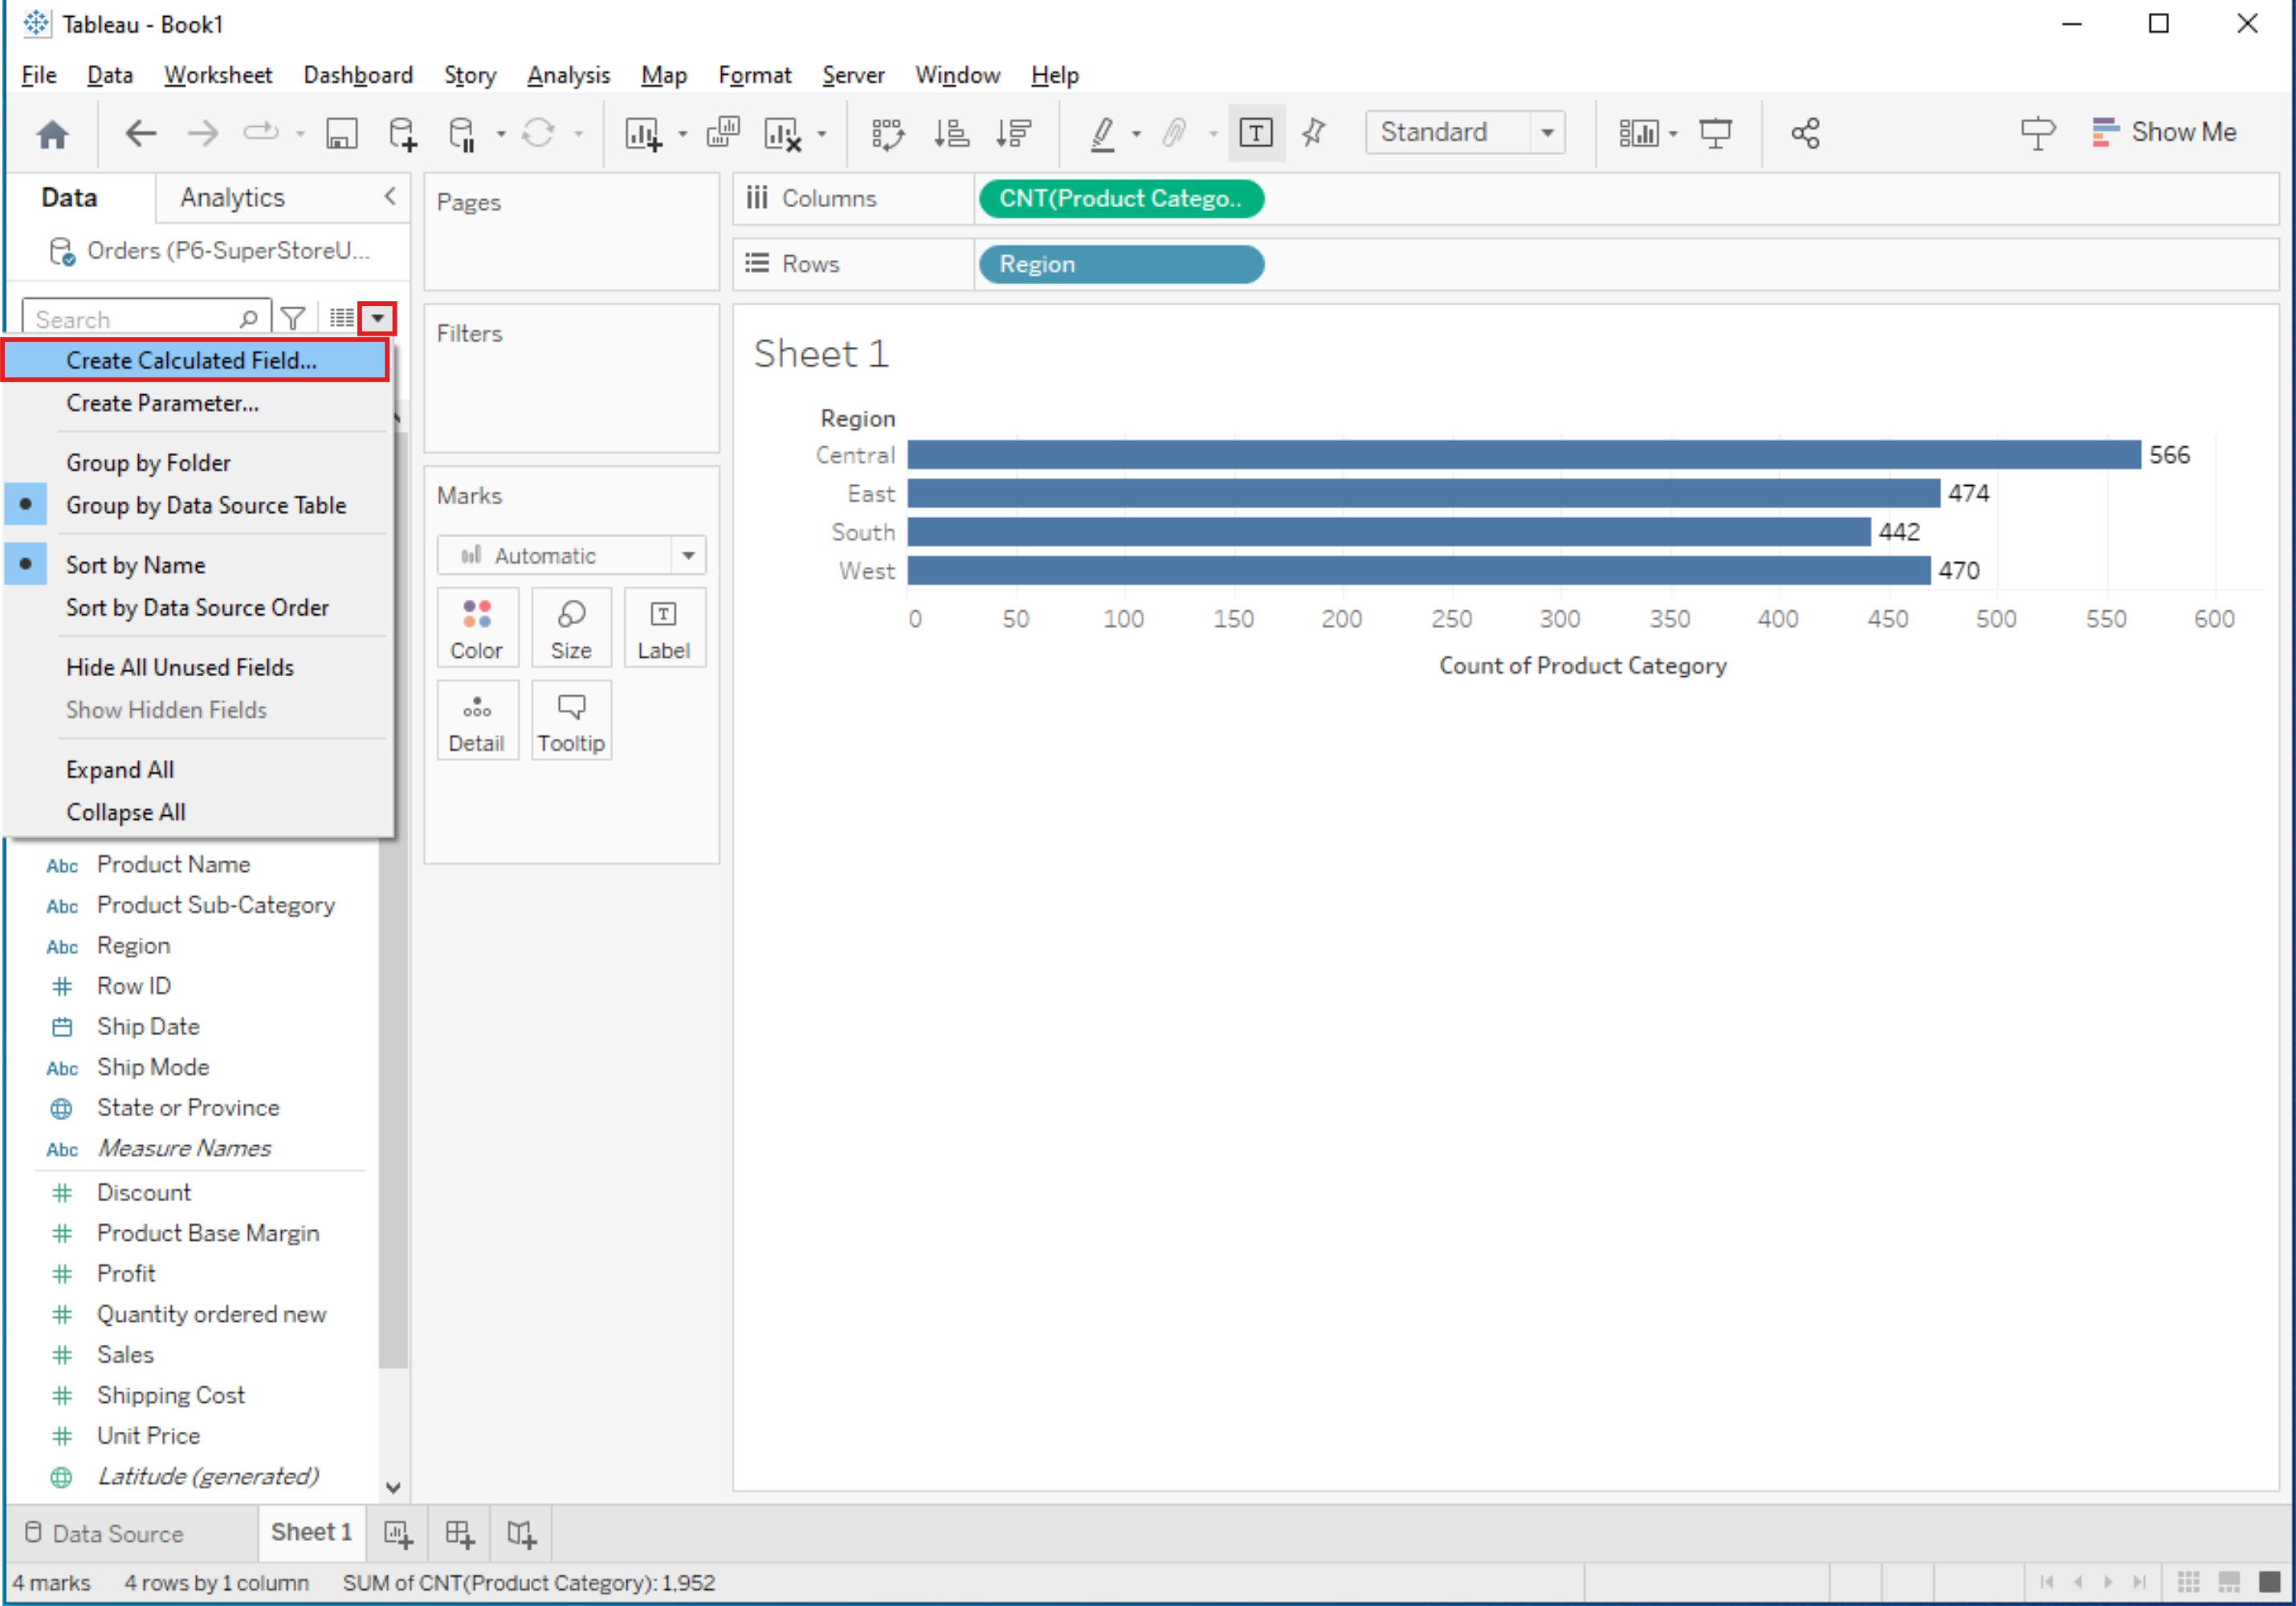
Alternatively, you can create a calculated field by right-clicking on a shelf in your worksheet and choosing "Create Calculated Field".
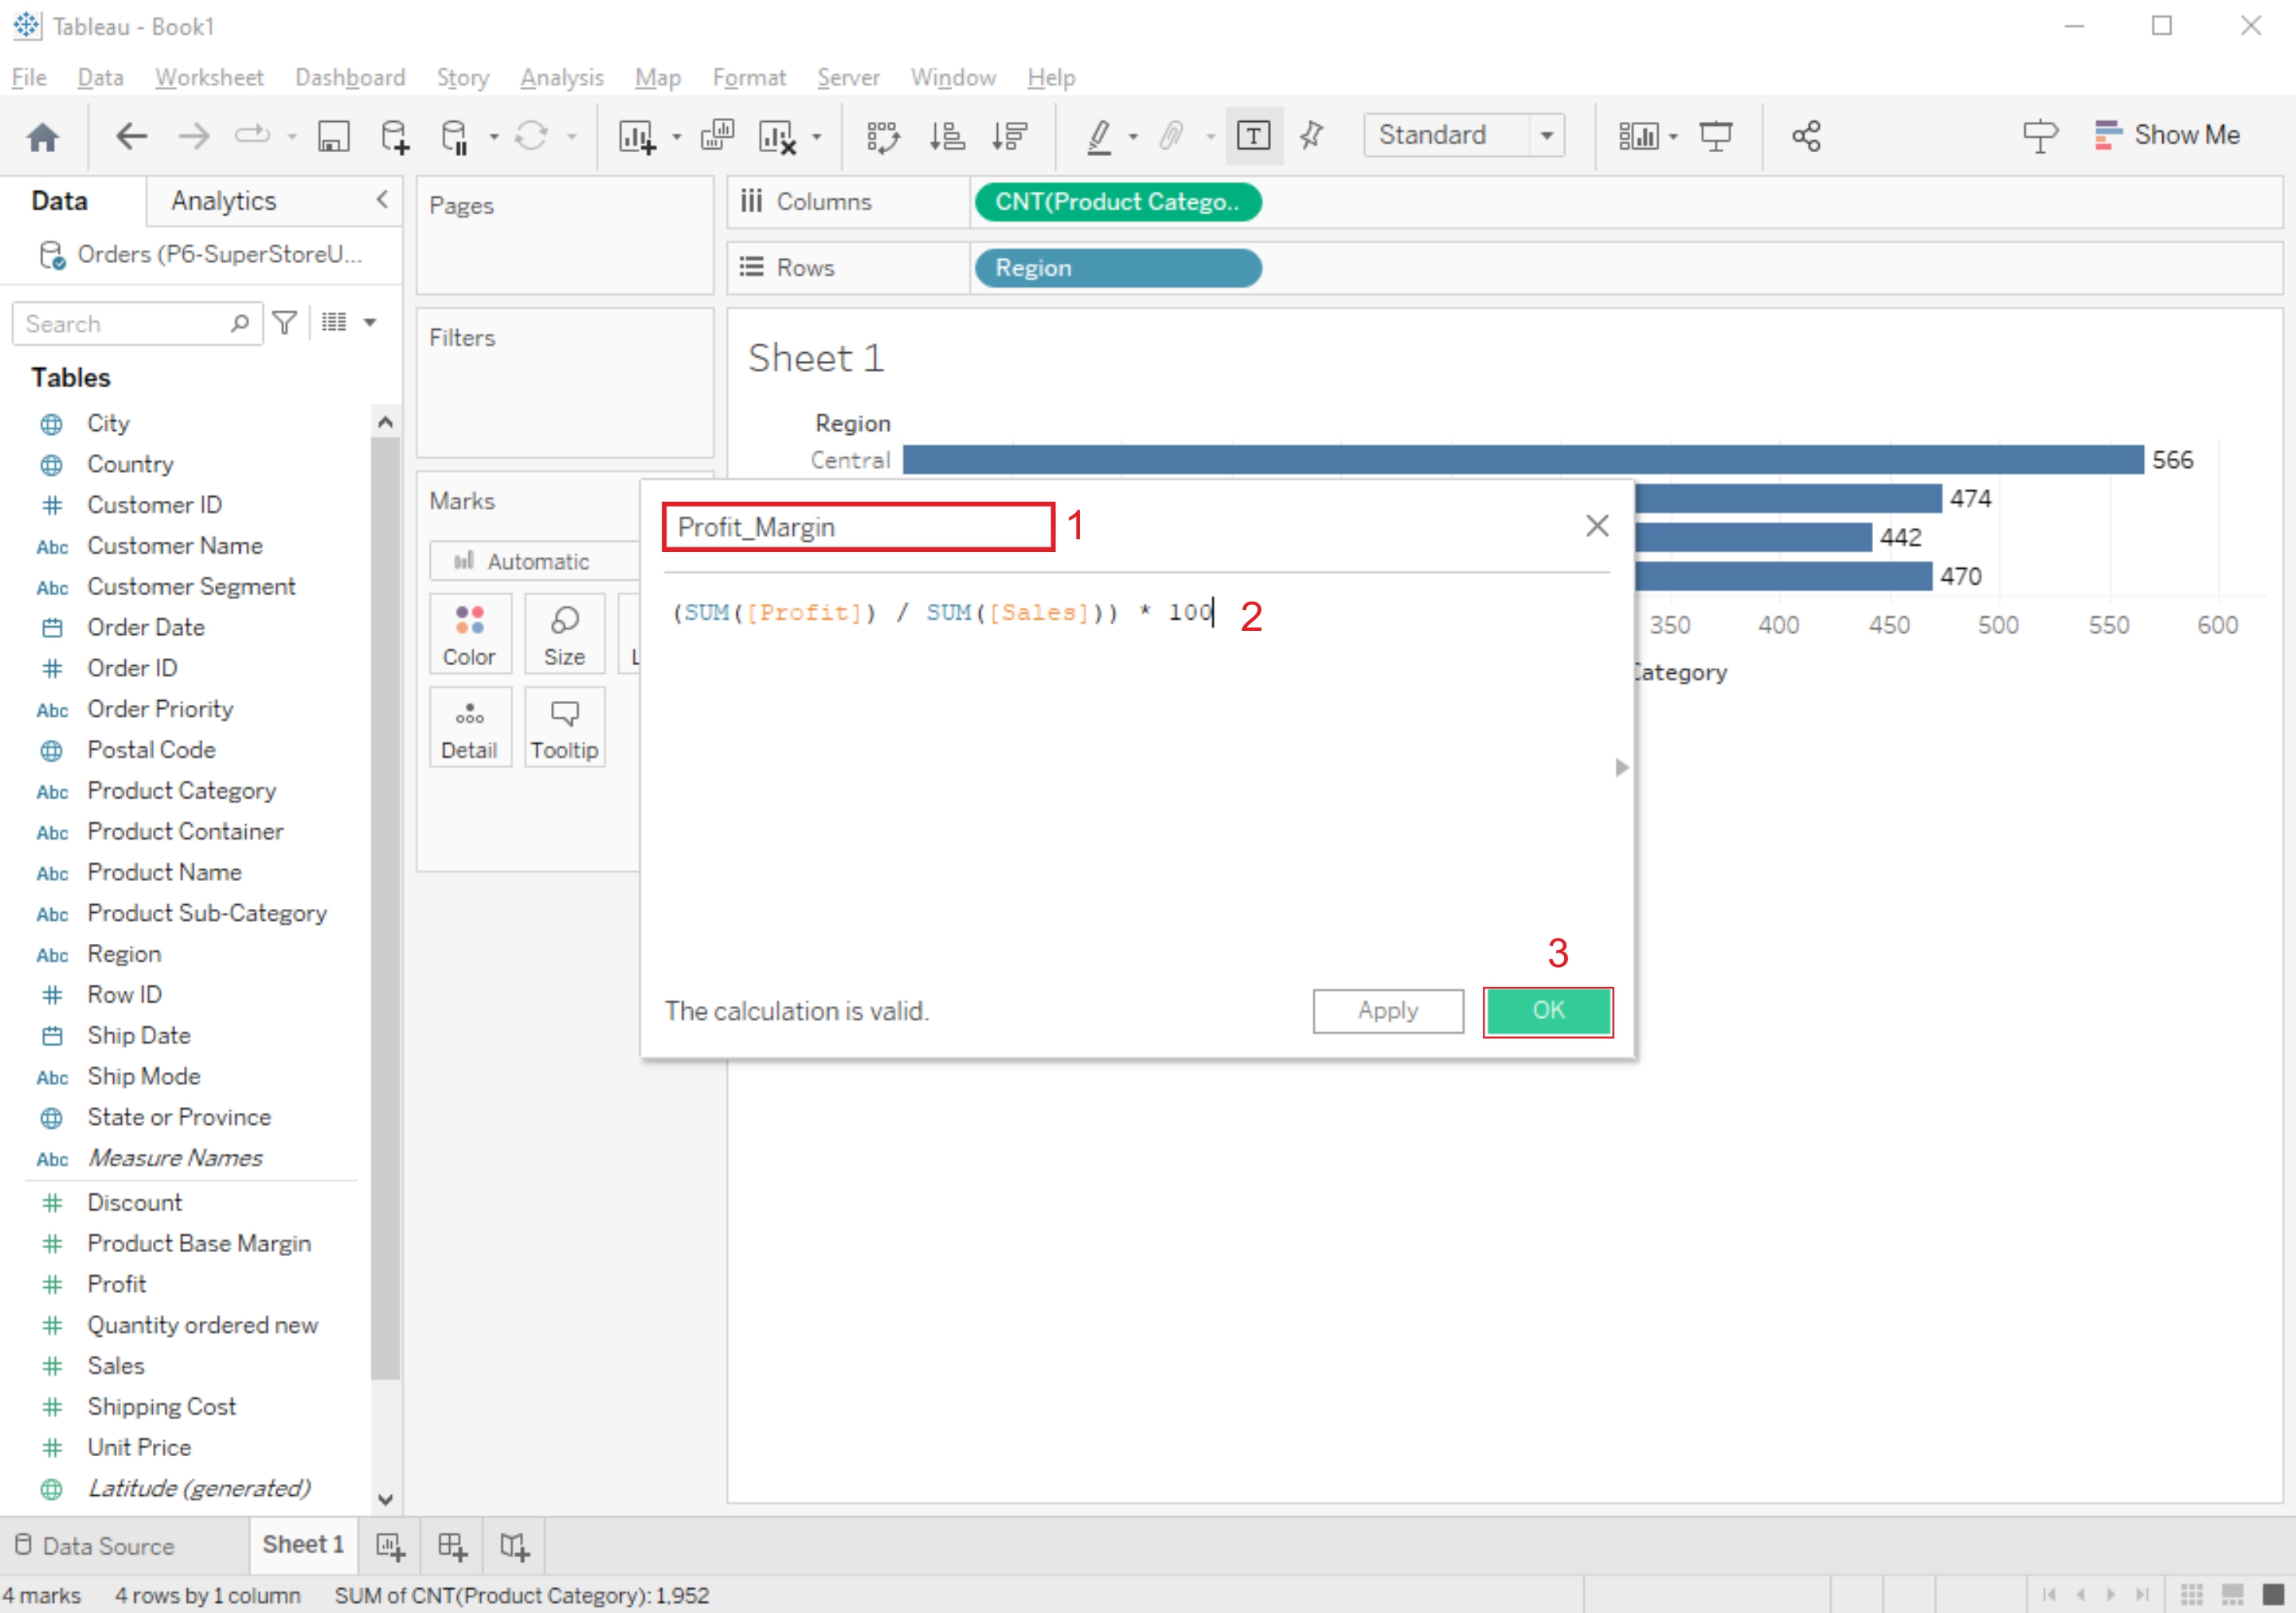
2. Enter Your Calculation:
In the calculated field editor, you can use functions, operators, and field references to define your calculation.
For example, you can create a calculated field to calculate profit margin as (SUM([Profit]) / SUM([Sales])) * 100.
3. Name and Save the Calculated Field:
Give your calculated field a meaningful name.
Click the "OK" or "Apply" button to save the calculated field.
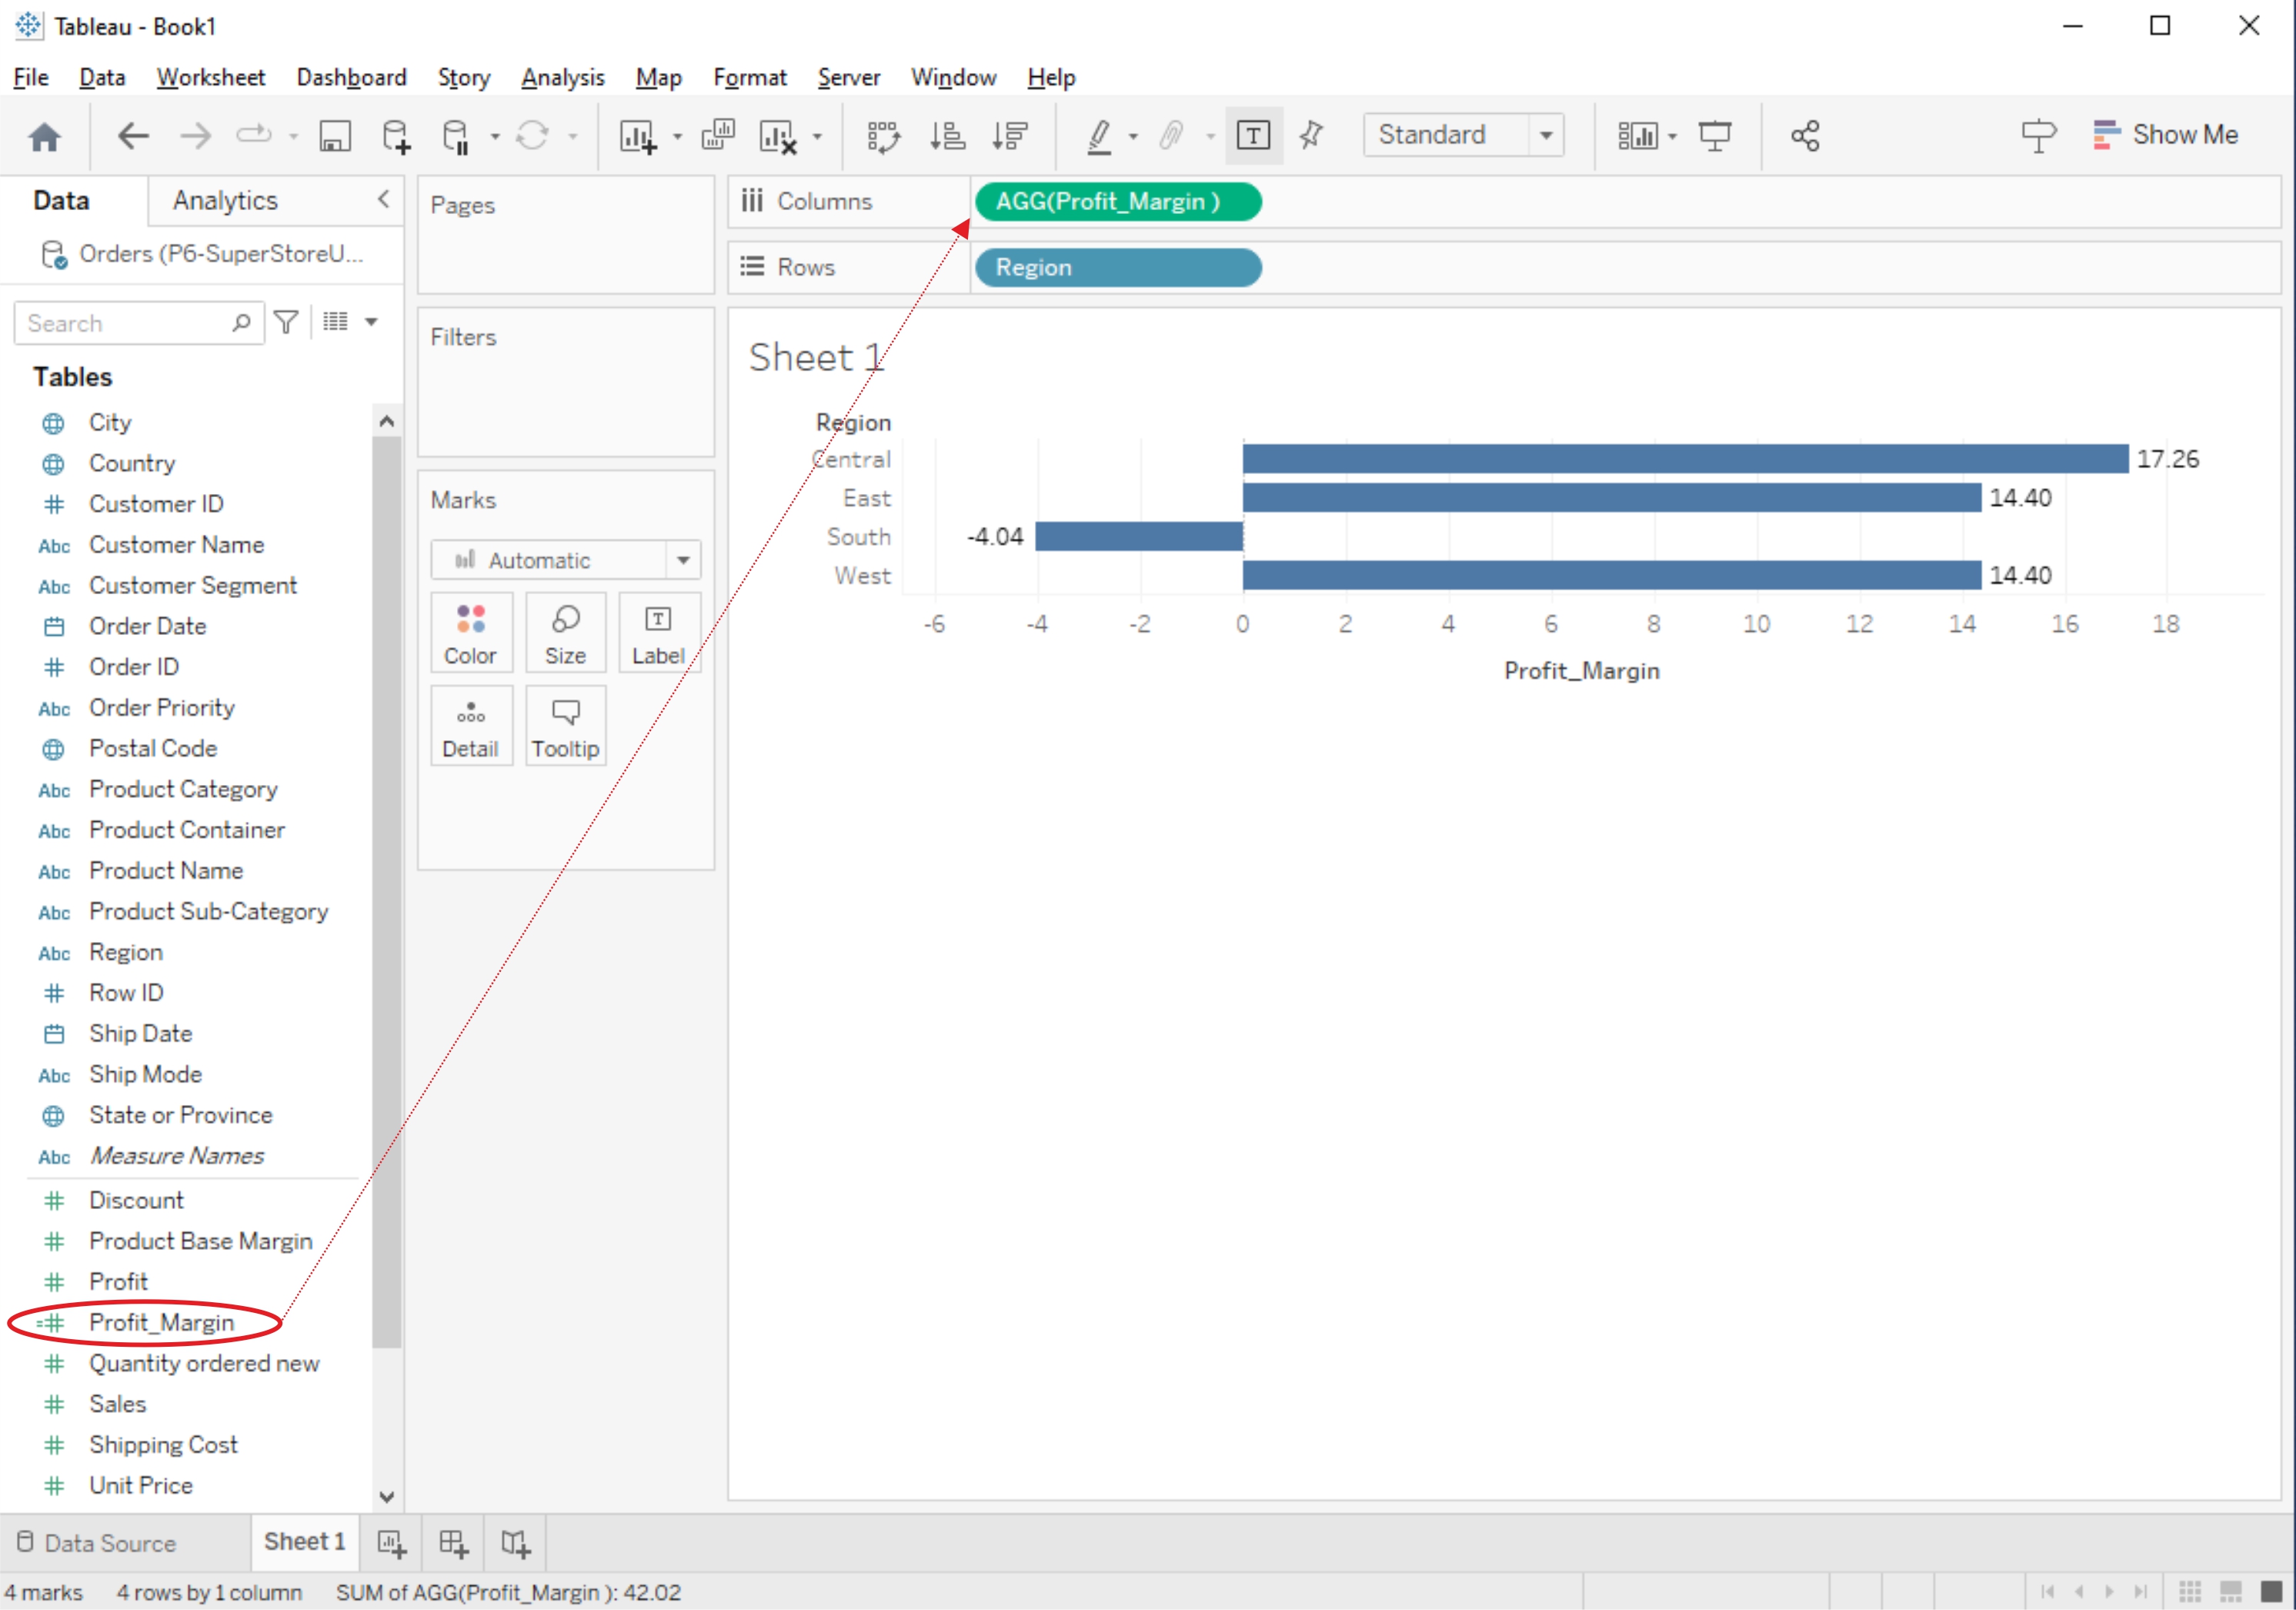
4. Use the Calculated Field in Your Worksheet:
You can now use the calculated field like any other field in your worksheet. Drag it to the Rows or Columns shelf, use it in filters, or create visualizations based on it.
Related Content :
Power BI Lab Programs
1) Understanding Data, What is data, where to find data, Foundations for building Data Visualizations,Creating Your First visualization? View Solution
2) Getting started with Tableau Software using Data file formats, connecting your Data to Tableau,creating basic charts(line, bar charts, Tree maps),Using the Show me panel. View Solution
3) Tableau Calculations, Overview of SUM, AVR, and Aggregate features, Creating custom calculationsand fields View Solution
4) Applying new data calculations to your visualizations, Formatting Visualizations, Formatting Toolsand Menus, Formatting specific parts of the view. View Solution
5) Editing and Formatting Axes, Manipulating Data in Tableau data, Pivoting Tableau data. View Solution
6) Structuring your data, Sorting and filtering Tableau data, Pivoting Tableau data. View Solution
7) Advanced Visualization Tools: Using Filters, Using the Detail panel, using the Size panels, customizing filters, Using and Customizing tooltips, Formatting your data with colors. View Solution
8) Creating Dashboards & Storytelling, creating your first dashboard and Story, Design for differentdisplays, adding interactivity to your Dashboard, Distributing & Publishing your Visualization. View Solution
9) Tableau file types, publishing to Tableau Online, Sharing your visualizations, printing, and Exporting. View Solution
10) Creating custom charts, cyclical data and circular area charts, Dual Axis charts. View Solution