Machine Learning - (LAB PROGRAMS)
☛ Write a python program to compute
• Central Tendency Measures: Mean, Median,Mode
• Measure of Dispersion: Variance, Standard Deviation
Solution :
Understanding Basic Statistics
Statistical analysis often involves understanding the central tendency and the dispersion of data. Below are the definitions, along with the formulas used for these measures.
1. Central Tendency Measures
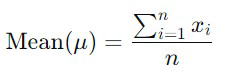
- Mean (𝜇): The arithmetic average of a set of values. It is calculated by summing all the data points and dividing by the number of data points.
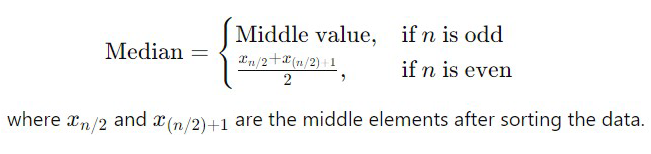
- Median: The median is the middle value in a sorted list of numbers. If the number of observations is even, the median is the average of the two middle numbers.
- Mode: The mode is the value that appears most frequently in a dataset.
Mode = most frequent value in the dataset
2. Measures of Dispersion
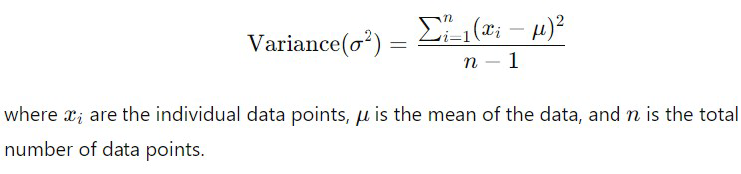
- Variance (σ²): Variance measures the spread of the data points around the mean. It is calculated as the average of the squared differences between each data point and the mean.
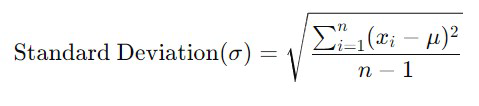
- Standard Deviation (σ): The standard deviation is the square root of the variance, providing a measure of the average distance from the mean. It is in the same units as the data, making it more interpretable compared to variance.
These measures provide insights into the distribution, central point, and spread of data, helping to understand the data's overall behaviour.
Source Code:
File Name: Stat_Measures.py
# Prompt user to enter data
user_input = input("Enter numbers separated by commas: ")

# Convert the input string to a list of integers
numbers = [int(num) for num in user_input.split(',')]

# Calculate the number of elements
count = len(numbers)

# Calculate the mean (average)
sum_of_numbers = sum(numbers)
mean_value = sum_of_numbers / count

# Sort the list for median calculation
sorted_numbers = sorted(numbers)

# Calculate the median
if count % 2 == 0:
    median_value = (sorted_numbers[count // 2 - 1] + sorted_numbers[count // 2]) / 2
else:
    median_value = sorted_numbers[count // 2]

# Calculate the mode
frequency_dict = {}
highest_frequency = 0

for num in numbers:
    if num in frequency_dict:
        frequency_dict[num] += 1
    else:
        frequency_dict[num] = 1
    if frequency_dict[num] > highest_frequency:
        highest_frequency = frequency_dict[num]

# Get all numbers with the highest frequency
modes = [num for num, freq in frequency_dict.items() if freq == highest_frequency]

# Calculate variance
squared_diff_sum = sum((num - mean_value) ** 2 for num in numbers)
variance_value = squared_diff_sum / count

# Calculate standard deviation
std_deviation = variance_value ** 0.5

# Display results
print(f"Mean = {mean_value}")
print(f"Median = {median_value}")
print(f"Mode = {modes if len(modes) < count else 'No mode (all values are unique)'}")
print(f"Variance = {variance_value}")
print(f"Standard Deviation = {std_deviation}")
Output:
Sample Run1:
--------------
$ python3 Stat_Measures.py
Enter numbers separated by commas: 1,2,3,4,4,5,6
Mean = 3.5714285714285716
Median = 4
Mode = [4]
Variance = 2.5306122448979593
Standard Deviation = 1.5907898179514348

Sample Run2:
--------------
$ python3 Stat_Measures.py
Enter numbers separated by commas: 10,20,30,30,40,40
Mean = 28.333333333333332
Median = 30.0
Mode = [30, 40]
Variance = 113.88888888888887
Standard Deviation = 10.671873729054747
Related Content :
Machine Learning Lab Programs
1) Write a python program to compute
• Central Tendency Measures: Mean, Median,Mode
• Measure of Dispersion: Variance, Standard Deviation View Solution
2) Study of Python Basic Libraries such as Statistics, Math, Numpy and Scipy View Solution
3) Study of Python Libraries for ML application such as Pandas and Matplotlib View Solution
4) Write a Python program to implement Simple Linear Regression View Solution
5) Implementation of Multiple Linear Regression for House Price Prediction using sklearn View Solution
6) Implementation of Decision tree using sklearn and its parameter tuning View Solution
7) Implementation of KNN using sklearn View Solution
8) Implementation of Logistic Regression using sklearn View Solution
9) Implementation of K-Means Clustering View Solution
10) Performance analysis of Classification Algorithms on a specific dataset (Mini Project) View Solution