Machine Learning - (LAB PROGRAMS)
☛ Study of Python Libraries for ML application such as Pandas and Matplotlib
Solution :
1. Pandas
Pandas is a fast, powerful, and flexible library used for data analysis and manipulation. It provides data structures like DataFrames and Series that are widely used in ML for managing structured data.
Key Features of Pandas
- Data Handling: Create, modify, and process structured data efficiently.
- File Input/Output: Read from and write to formats like CSV, Excel, JSON,SQL, etc.
- Data Cleaning: Handle missing data, filter rows/columns, and apply transformations.
- Data Aggregation: Group data for summarization and analysis.
Key Functions:
- pandas.read_csv(file_path)
a. Reads a CSV file into a Pandas DataFrame. b. Parameters: i. file_path: The path of the CSV file. c. Returns: A Pandas DataFrame. - df.loc[[row_indices]]
a. Accesses specified rows (and optionally columns) in the DataFrame using labels or indices.
b. Parameters:
i. row_indices: A list of row indices to fetch. - df.head(n)
a. Displays the first n rows of the DataFrame (default is 5). - df.tail(n)
a. Displays the last n rows of the DataFrame (default is 5). - df.isnull()
a. Returns a DataFrame of the same shape, indicating the presence of missing values. - df.info()
a. Prints a summary of the DataFrame, including data types, non-null values, and memory usage.
Library Installation:
To install Pandas library, Open Command Prompt or Terminal and execute the following commands
# To install Pandas on Linux
$ sudo apt install python3-pip
$ pip3 install pandas

# To install Pandas on Windows
pip install pandas
CSV file : "students.csv"
Student_NO,Name,Branch,Year,Contact_NO
1201,Raghu,IT,III,1234
1202,Sai,IT,III,1234
1203,Sravan,IT,III,1234
1204,Karthik,IT,III,1234
1205,Gaanesh,IT,III,1234
1206,Vamshi,IT,III,1234
1207,Shiva,IT,III,1234
1208,Racha,IT,III,1234
1209,Abu,IT,III,1234
1210,Nithish,IT,III,1234
To Download above CSV file : Click Here
Source Code:
File Name: Pandas_Lib.py
import pandas
df=pandas.read_csv('students.csv')
print(df)
print(df.loc[[0,1]])
print(df.head())
print(df.tail())
print(df.isnull())
print(df.info())
Output:
Sample Run:
--------------
$python3 Pandas_Lib.py
   Student_NO     Name Branch Year  Contact_NO
0        1201    Raghu     IT  III        1234
1        1202      Sai     IT  III        1234
2        1203   Sravan     IT  III        1234
3        1204  Karthik     IT  III        1234
4        1205  Gaanesh     IT  III        1234
5        1206   Vamshi     IT  III        1234
6        1207    Shiva     IT  III        1234
7        1208    Racha     IT  III        1234
8        1209      Abu     IT  III        1234
9        1210  Nithish     IT  III        1234
   Student_NO   Name Branch Year  Contact_NO
0        1201  Raghu     IT  III        1234
1        1202    Sai     IT  III        1234
   Student_NO     Name Branch Year  Contact_NO
0        1201    Raghu     IT  III        1234
1        1202      Sai     IT  III        1234
2        1203   Sravan     IT  III        1234
3        1204  Karthik     IT  III        1234
4        1205  Gaanesh     IT  III        1234
   Student_NO     Name Branch Year  Contact_NO
5        1206   Vamshi     IT  III        1234
6        1207    Shiva     IT  III        1234
7        1208    Racha     IT  III        1234
8        1209      Abu     IT  III        1234
9        1210  Nithish     IT  III        1234
   Student_NO   Name  Branch   Year  Contact_NO
0       False  False   False  False       False
1       False  False   False  False       False
2       False  False   False  False       False
3       False  False   False  False       False
4       False  False   False  False       False
5       False  False   False  False       False
6       False  False   False  False       False
7       False  False   False  False       False
8       False  False   False  False       False
9       False  False   False  False       False

RangeIndex: 10 entries, 0 to 9
Data columns (total 5 columns):
 #   Column      Non-Null Count  Dtype
---  ------      --------------  -----
 0   Student_NO  10 non-null     int64
 1   Name        10 non-null     object
 2   Branch      10 non-null     object
 3   Year        10 non-null     object
 4   Contact_NO  10 non-null     int64
dtypes: int64(2), object(3)
memory usage: 532.0+ bytes
None
2.Matplotlib:
Matplotlib is a plotting library used for creating static, interactive, and animated visualizations. It is commonly used in ML for data exploration and model evaluation through plots.
Key Features of Matplotlib
- Visualization Types: Create line plots, bar plots, scatter plots, histograms,etc.
- Customization: Customize plot styles, labels, legends, and colors.
- Interactive Plots: Zoom and pan to explore data visually.
Key Functions:
plt.plot(x, y, marker='o')
- Plots x vs. y as a line graph, with markers at each data point.
- Parameters:
- x: Data for the x-axis.
- y: Data for the y-axis.
- marker: (optional) Defines the marker style (e.g., 'o' for circles).
- Returns: A plot object.
plt.xlabel('X-axis')
- Sets the label for the x-axis.
- Parameters: A string for the x-axis label.
- Returns: None.
plt.ylabel('Y-axis')
- Sets the label for the y-axis.
- Parameters: A string for the y-axis label.
- Returns: None.
plt.title('User Input Plot')
- Sets the title of the plot.
- Parameters: A string for the title.
- Returns: None.
plt.grid(True)
- Adds a grid to the plot.
- Parameters: True to enable the grid.
- Returns: None.
plt.show()
- Displays the plot to the user.
- Parameters: None.
- Returns: None.
Library Installation:
To install matplotlib library, Open Command Prompt or Terminal and execute the following commands
# To install matplotlib on Linux
$ sudo apt install python3-pip
$ pip3 install matplotlib

# To install matplotlib on Windows
pip install matplotlib
Source Code:
File Name: Matplot_Lib.py
import matplotlib.pyplot as plt
import numpy as np
# Taking user inputs for x and y coordinates
x_input = input("Enter the x coordinates separated by spaces: ")
y_input = input("Enter the y coordinates separated by spaces: ")
# Splitting the input string into a list of strings, then converting them to float
x = np.array([float(i) for i in x_input.split()])
y = np.array([float(i) for i in y_input.split()])
# Checking if the number of x and y coordinates match
if len(x) != len(y):
print("Error: The number of x and y coordinates must be the same.")
else:
plt.plot(x, y, marker='o') # Plot with markers at data points
plt.xlabel('X-axis')
plt.ylabel('Y-axis')
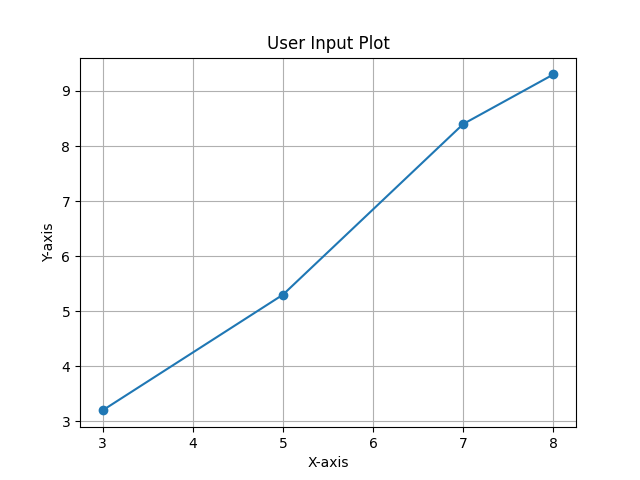
plt.title('User Input Plot')
plt.grid(True) # Adding a grid for better visualization
plt.show()
Output:
Sample Run:
--------------
$python3 Matplot_Lib.py

Enter the x coordinates separated by spaces: 3 5 7 8
Enter the y coordinates separated by spaces: 3.2 5.3 8.4 9.3
Related Content :
Machine Learning Lab Programs
1) Write a python program to compute
• Central Tendency Measures: Mean, Median,Mode
• Measure of Dispersion: Variance, Standard Deviation View Solution
2) Study of Python Basic Libraries such as Statistics, Math, Numpy and Scipy View Solution
3) Study of Python Libraries for ML application such as Pandas and Matplotlib View Solution
4) Write a Python program to implement Simple Linear Regression View Solution
5) Implementation of Multiple Linear Regression for House Price Prediction using sklearn View Solution
6) Implementation of Decision tree using sklearn and its parameter tuning View Solution
7) Implementation of KNN using sklearn View Solution
8) Implementation of Logistic Regression using sklearn View Solution
9) Implementation of K-Means Clustering View Solution
10) Performance analysis of Classification Algorithms on a specific dataset (Mini Project) View Solution