Machine Learning - (LAB PROGRAMS)
☛ Implementation of Multiple Linear Regression for House Price Prediction using sklearn.
Solution :
Multiple Linear Regression attempts to model the relationship between two or more features and a response by fitting a linear equation to observed data. The steps to perform multiple linear Regression are almost similar to that of simple linear Regression. The Difference Lies in the evaluation. We can use it to find out which factor has the highest impact on the predicted output and how different variables relate to each other.
Y = b0 + b1 * x1 + b2 * x2 + b3 * x3 + …… bn * xn

Y = Dependent variable

x1, x2, x3, …… xn = multiple independent variables
Step-1: Data Pre-processing
Step-2: Fitting our MLR model to the Training set
Step-3: Prediction of test set result
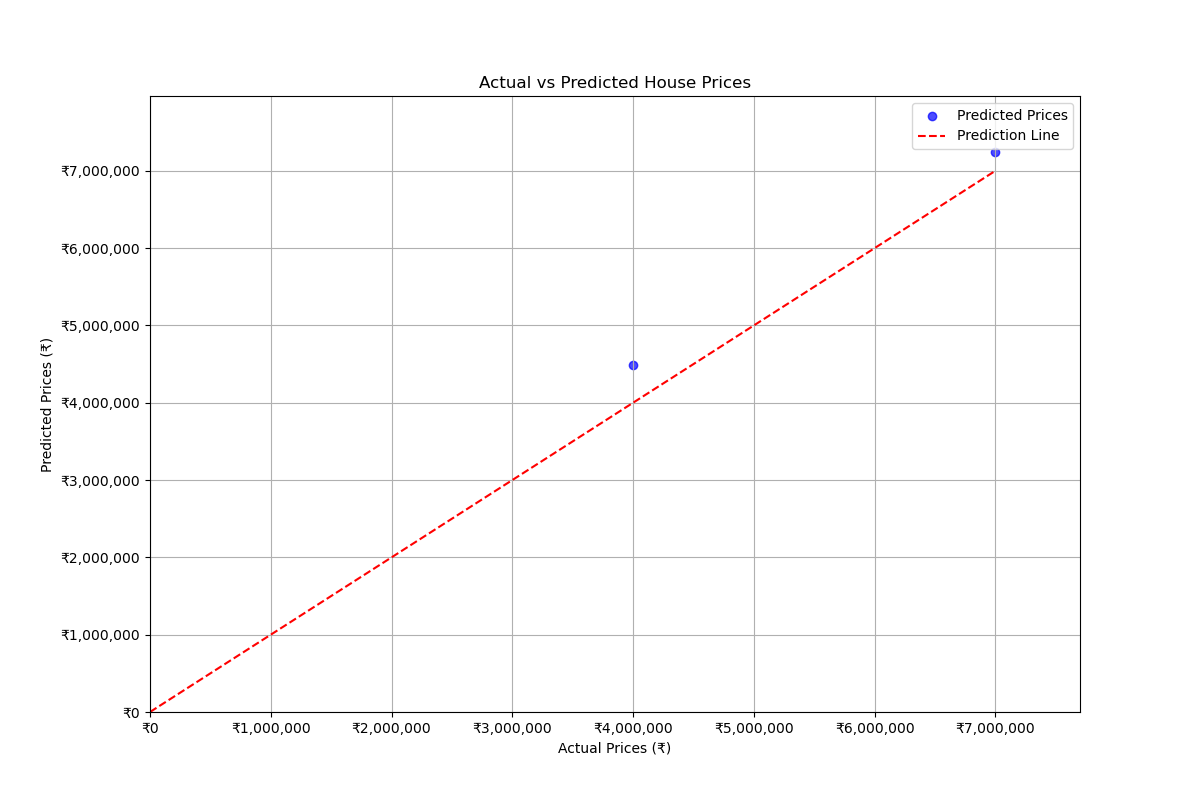
Step-4: visualizing the results
Library Installation:
To install required library files, Open Command Prompt or Terminal and execute the following commands
$ pip install scikit-learn

$ pip install pandas

$ pip install numpy

$ pip install matplotlib
CSV file : "house_data.csv"
price,area,bedrooms,floors,age
4500000,1500,3,2,5
7000000,2500,4,3,4
3000000,1200,2,1,2
5500000,1800,3,2,4
9000000,3000,5,4,5
3500000,1400,3,2,5
6000000,2200,4,3,1
10000000,3500,5,4,4
4000000,1600,3,2,3
6500000,2000,4,3,4
To Download above CSV file : Click Here
Source Code:
File Name: Multiple_Linear_Regression.py
import pandas as pd
import numpy as np
import matplotlib.pyplot as plt
from sklearn.model_selection import train_test_split
from sklearn.linear_model import LinearRegression
from sklearn.metrics import mean_squared_error, r2_score
from matplotlib.ticker import FuncFormatter

data = pd.read_csv('house_data.csv')
X = data.drop('price', axis=1)
y = data['price']

X_train, X_test, y_train, y_test = train_test_split(X, y, test_size=0.2,random_state=42)
model = LinearRegression().fit(X_train, y_train)
y_pred = model.predict(X_test)

print(f"Mean Squared Error: {mean_squared_error(y_test, y_pred):.2f}")
print(f"R^2 Score: {r2_score(y_test, y_pred):.2f}")
print(f"Model Coefficients: {model.coef_}")
print(f"Model Intercept: {model.intercept_}")

area = float(input("Enter area (sq ft): "))
bedrooms = int(input("Enter number of bedrooms: "))
floors = int(input("Enter number of floors: "))
age = int(input("Enter age of the house: "))
input_data = pd.DataFrame([[area, bedrooms, floors, age]], columns=['area', 'bedrooms', 'floors', 'age'])
input_data_encoded = input_data.reindex(columns=X.columns, fill_value=0)
predicted_price = model.predict(input_data_encoded)

print(f"Predicted price for the house: ₹{predicted_price[0]:,.2f}")
plt.figure(figsize=(12, 8)) # Adjusted size
plt.scatter(y_test, y_pred, alpha=0.7, label="Predicted Prices", color='blue', marker='o')
plt.plot([0, max(y_test)], [0, max(y_test)], color='red', linestyle='--', label="Prediction Line")
plt.xlabel("Actual Prices (₹)")
plt.ylabel("Predicted Prices (₹)")
plt.title("Actual vs Predicted House Prices")

# Use safe formatter instead of set_xticklabels/set_yticklabels
formatter = FuncFormatter(lambda x, pos: f'₹{int(x):,}')
plt.gca().xaxis.set_major_formatter(formatter)
plt.gca().yaxis.set_major_formatter(formatter)

plt.legend()
plt.xlim(0, max(y_test) * 1.1)
plt.ylim(0, max(y_pred) * 1.1)
# Grid and display
plt.grid(True)
plt.show()
Output:
Sample Run:
--------------
$ python3 Multiple_Linear_Regression.py
Mean Squared Error: 147133574968.89
R^2 Score: 0.93
Model Coefficients: [  2518.89168766 198012.87433529 198012.87433529  94458.43828715]
Model Intercept: -818499.8600628739
Enter area (sq ft): 200
Enter number of bedrooms: 3
Enter number of floors: 2
Enter age of the house: 2
Predicted price for the house: ₹864,259.73
Related Content :
Machine Learning Lab Programs
1) Write a python program to compute
• Central Tendency Measures: Mean, Median,Mode
• Measure of Dispersion: Variance, Standard Deviation View Solution
2) Study of Python Basic Libraries such as Statistics, Math, Numpy and Scipy View Solution
3) Study of Python Libraries for ML application such as Pandas and Matplotlib View Solution
4) Write a Python program to implement Simple Linear Regression View Solution
5) Implementation of Multiple Linear Regression for House Price Prediction using sklearn View Solution
6) Implementation of Decision tree using sklearn and its parameter tuning View Solution
7) Implementation of KNN using sklearn View Solution
8) Implementation of Logistic Regression using sklearn View Solution
9) Implementation of K-Means Clustering View Solution
10) Performance analysis of Classification Algorithms on a specific dataset (Mini Project) View Solution