Machine Learning - (LAB PROGRAMS)
☛ Implementation of K-Means Clustering.
Solution :
K-Means Clustering:
K-Means is a popular unsupervised machine learning algorithm used for partitioning a dataset into K clusters based on the similarity of their features. It works by minimizing the variance within each cluster and is widely used in applications such as market segmentation, image compression, and pattern recognition.
K means clustering, assigns data points to one of the K clusters depending on their distance from the center of the clusters. It starts by randomly assigning the clusters centroid in the space. Then each data point assign to one of the cluster based on its distance from centroid of the cluster. After assigning each point to one of the cluster, new cluster centroids are assigned. This process runs iteratively until it finds good cluster. In the analysis we assume that number of cluster is given in advanced and we have to put points in one of the group.
ALGORITHM:
- Initialization:
- Choose the number of clusters (k) to divide the data into.
- Initialize the centroids (cluster centers) randomly or using specific techniques.
- Assignment:
- Assign each data point to the nearest centroid based on the distance (e.g., Euclidean distance).
- Each data point is labeled as belonging to one of the k clusters.
- Update:
- Recalculate the centroids of the clusters by averaging the coordinates of all data points assigned to each cluster.
- Repeat:
- Repeat the Assignment and Update steps iteratively until the centroids stabilize (i.e., no significant changes in their positions) or a predefined number of iterations is reached.
Steps for Program:
- Import Necessary Libraries:
numpy: For numerical computations.matplotlib.pyplot: For visualizing the data points and clustering results.KMeansfromsklearn.cluster: To implement the K-Means algorithm.make_blobsfromsklearn.datasets: To generate synthetic data for clustering.
- Generate Synthetic Data:
- The
make_blobsfunction generates 300 data points with 4 clusters. The points are distributed with a standard deviation of 0.60 around the cluster centers. - The dataset consists of:
Features (X): A 2D array representing the data points' coordinates.
- The
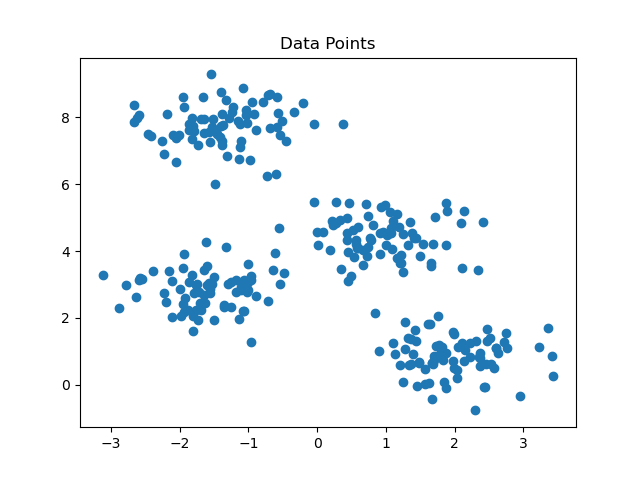
- Visualize Raw Data:
- A scatter plot is created to visualize the data points before clustering.
- Apply K-Means Algorithm:
- The K-Means model is initialized with
n_clusters=4to specify 4 clusters. - The model is fit to the data using the
fitmethod.
- The K-Means model is initialized with
- Retrieve Cluster Information:
- Cluster Centers: The coordinates of the centroids for each cluster are stored in
kmeans.cluster_centers_. - Cluster Labels: Each data point is assigned a cluster label using
kmeans.labels_.
- Cluster Centers: The coordinates of the centroids for each cluster are stored in
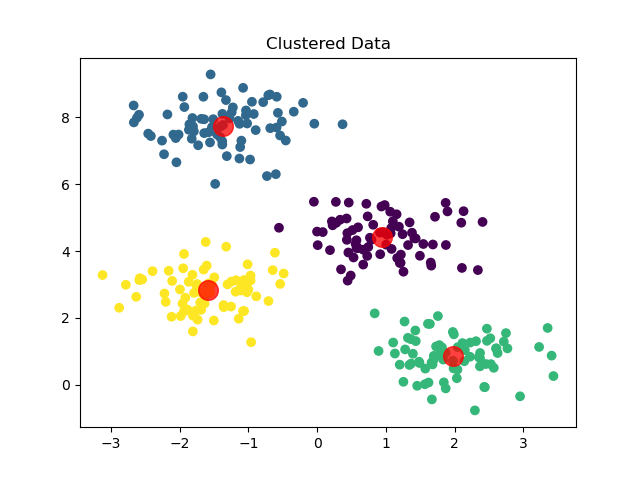
- Visualize Clustered Data:
- A scatter plot shows the data points grouped into clusters, with colors representing different clusters.
- Cluster centroids are displayed as red points to highlight their locations.
Library Installation:
To install required libraries, Open Command Prompt or Terminal and execute the following commands
$ pip install scikit-learn

$ pip install numpy

$ pip install matplotlib
Source Code:
File Name: kmeans.py
#Necessary Libraries
import numpy as np
import matplotlib.pyplot as plt
from sklearn.cluster import KMeans
from sklearn.datasets import make_blobs

#Generate Data
X, _ = make_blobs(n_samples = 300, centers = 4 , cluster_std = 0.60,random_state = 0)

#Plot the data points
plt.scatter(X[:,0],X[:,1])
plt.title("Data Points")
plt.show()

#KMeans clustering
kmeans = KMeans(n_clusters = 4)
kmeans.fit(X)

#Getting the cluster centers and labels
centers = kmeans.cluster_centers_ #returns the coordinates of the

#cluster center found by the algorithm
labels = kmeans.labels_ #Returns the labels for each data point , indicating which cluster it has

#been assigned to.
#Plot the clustered data
plt.scatter(X[:,0],X[:,1],c = labels)
plt.scatter(centers[:,0],centers[:,1],alpha = 0.75,s=200,color = 'red')
plt.title("Clustered Data")
plt.show()
Output:
Sample Run:
--------------
$ python3 kmeans.py
Related Content :
Machine Learning Lab Programs
1) Write a python program to compute
• Central Tendency Measures: Mean, Median,Mode
• Measure of Dispersion: Variance, Standard Deviation View Solution
2) Study of Python Basic Libraries such as Statistics, Math, Numpy and Scipy View Solution
3) Study of Python Libraries for ML application such as Pandas and Matplotlib View Solution
4) Write a Python program to implement Simple Linear Regression View Solution
5) Implementation of Multiple Linear Regression for House Price Prediction using sklearn View Solution
6) Implementation of Decision tree using sklearn and its parameter tuning View Solution
7) Implementation of KNN using sklearn View Solution
8) Implementation of Logistic Regression using sklearn View Solution
9) Implementation of K-Means Clustering View Solution
10) Performance analysis of Classification Algorithms on a specific dataset (Mini Project) View Solution