R Programming - (LAB PROGRAMS)
Aim:
☛ Write an R program to draw i) Pie chart ii) 3D Pie Chart, iii) Bar Chart along with chart legend by considering suitable CSV file.
Solution :
CSV file : "scores.csv"
Subject,Score
Math,85
Science,90
English,75
History,60
Computer,95
To Download above CSV file : Click Here
R Program: charts.R
# Install and load plotrix package for for 3D Pie Chart
if(!require(plotrix)) {
install.packages("plotrix")
library(plotrix)
}
# Read the CSV file
data <- read.csv("scores.csv")
# Extract subjects and scores
subjects <- data$Subject
scores <- data$Score
# Set colors for charts
colors <- rainbow(length(scores))
# Pie Chart with Legend
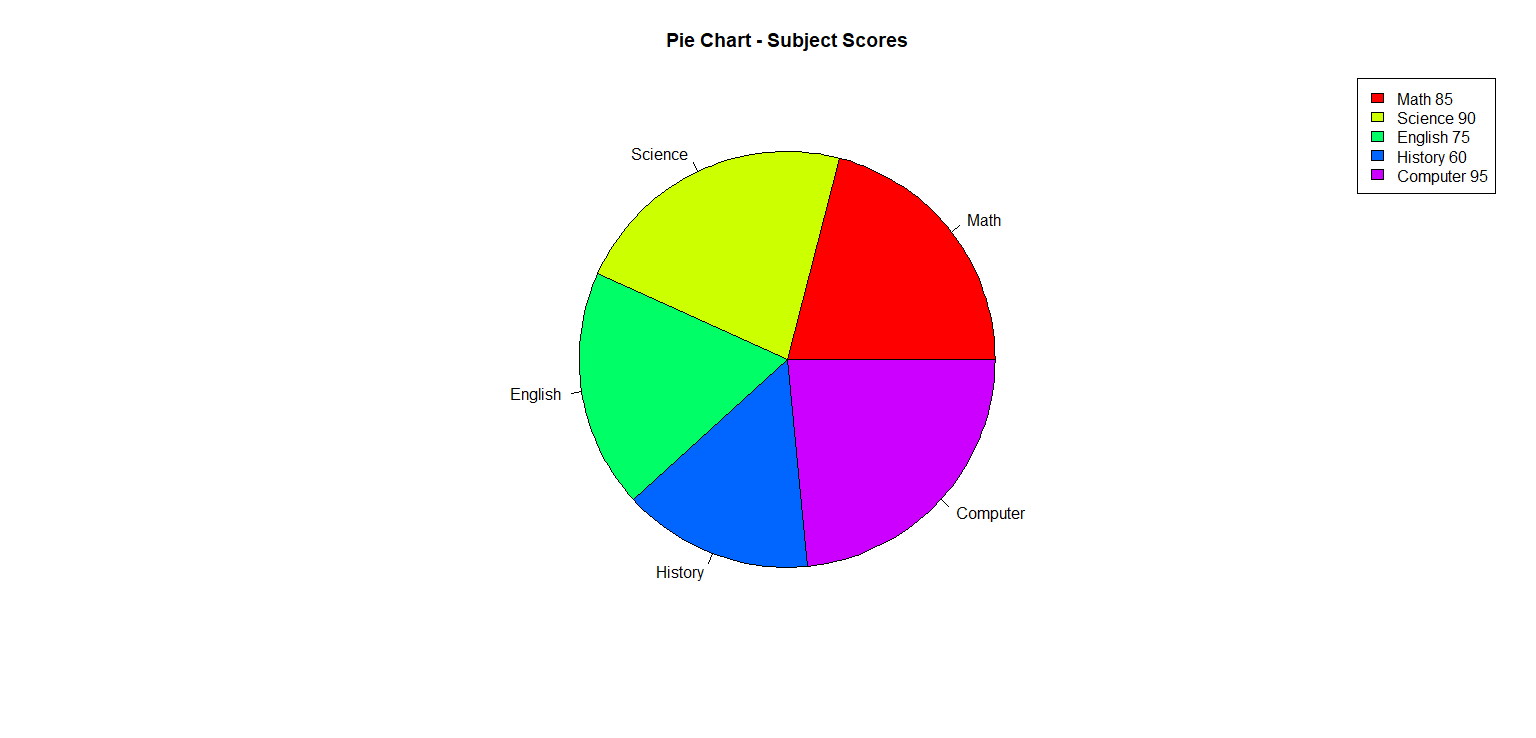
pie(scores, labels = subjects, col = colors, main = "Pie Chart - Subject Scores")
legend("topright", legend = paste(subjects, scores), fill = colors)
# To display multiple windows
windows()
# 3D Pie Chart with Legend
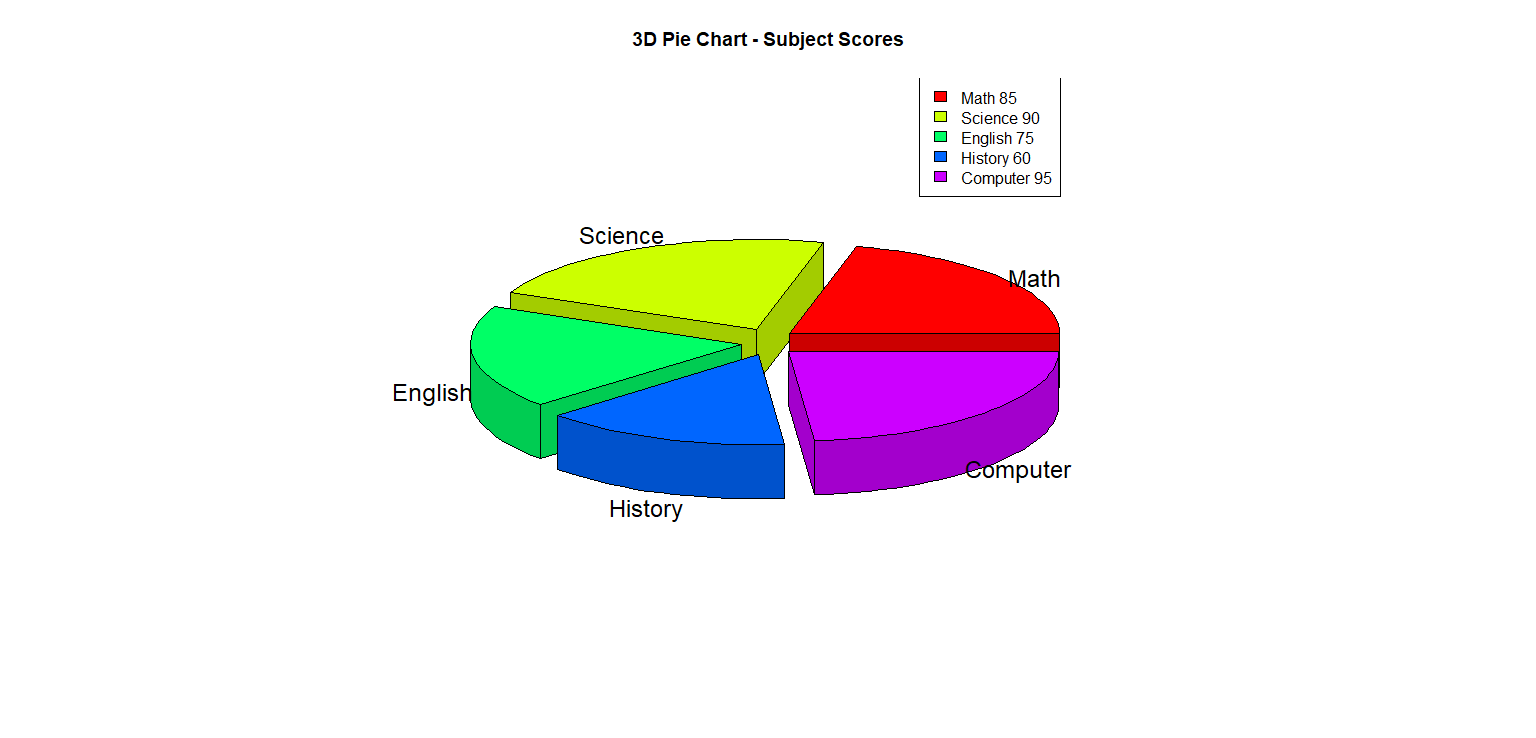
pie3D(scores, labels = subjects, col = colors, explode = 0.1, main = "3D Pie Chart - Subject Scores")
legend("topright", legend = paste(subjects, scores), fill = colors)
# To display multiple windows
windows()
# Bar Chart with Legend
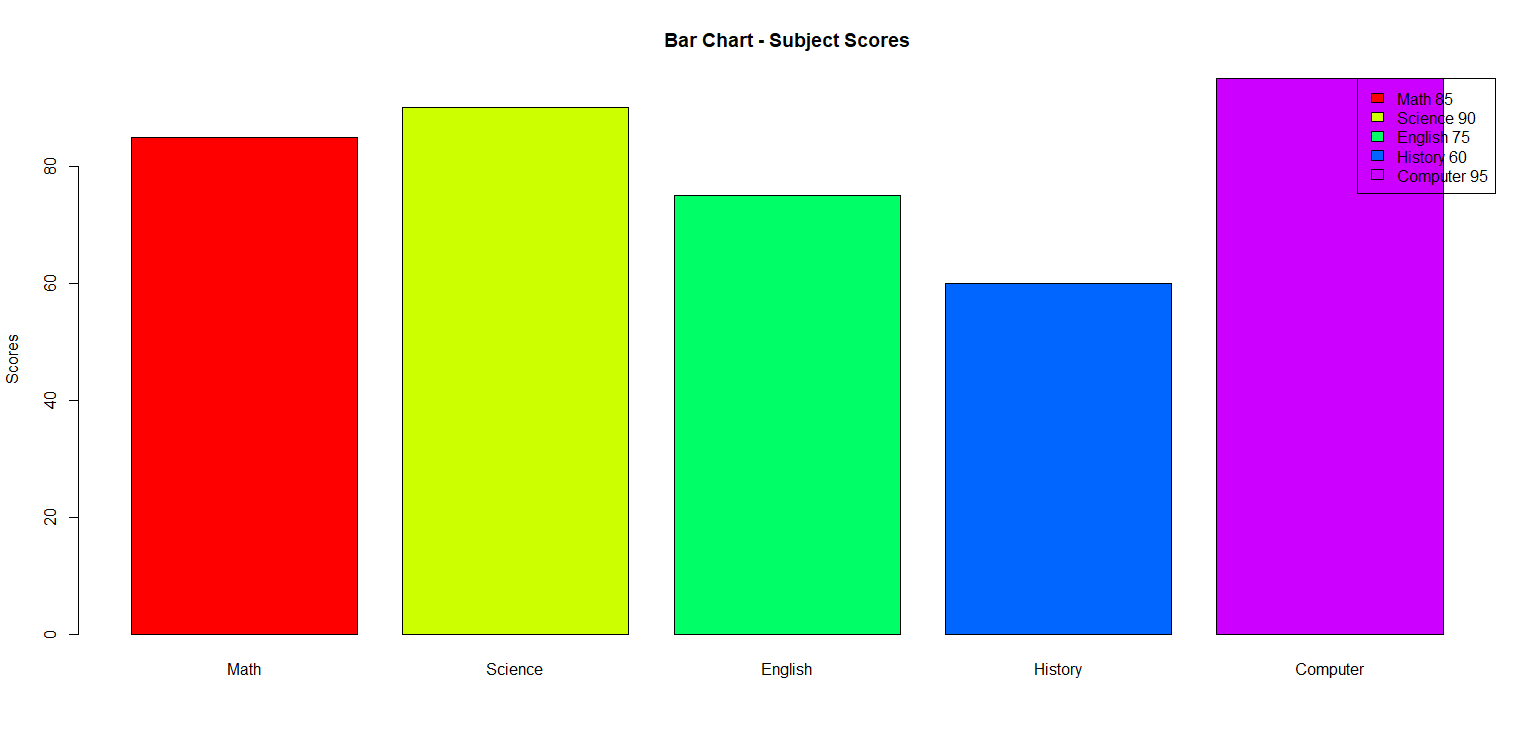
barplot(scores, names.arg = subjects, col = colors, main = "Bar Chart - Subject Scores", ylab = "Scores")
legend("topright", legend = paste(subjects, scores), fill = colors)
Output:
PIE CHART
3D PIE CHART
BAR CHART
Related Content :
1. Download and install R-Programming environment and install basic packages using install. packages() command in R. View Solution
2. Learn all the basics of R-Programming (Data types, Variables, Operators etc,.) View Solution
3. Write R command to
i) Illustrate summation, subtraction, multiplication, and division operations on vectors using vectors.
ii) Enumerate multiplication and division operations between matrices and vectors in R console. View Solution
4. Write R command to
i) Illustrates the usage of Vector subsetting and Matrix subsetting
ii) Write a program to create an array of 3 X 3 matrixes with 3 rows and 3 columns. View Solution
5. Write an R program to draw i) Pie chart ii) 3D Pie Chart, iii) Bar Chart along with chart legend by considering suitable CSV file. View Solution
6. Create a CSV file having Speed and Distance attributes with 1000 records. Write R program to draw
i) Box plots
ii) Histogram
iii) Line Graph
iv) Multiple line graphs
v) Scatter plot
to demonstrate the relation between the cars speed and the distance. View Solution
7. Implement different data structures in R (Vectors, Lists, Data Frames). View Solution
8. Write an R program to read a csv file and analyze the data in the file using EDA (Explorative Data Analysis) techniques. View Solution
9. Write an R program to illustrate Linear Regression and Multi linear Regression considering suitable CSV file. View Solution