R Programming - (LAB PROGRAMS)
Aim:
☛ Create a CSV file having Speed and Distance attributes with 1000 records. Write R program to draw
i) Box plots
ii) Histogram
iii) Line Graph
iv) Multiple line graphs
v) Scatter plot
to demonstrate the relation between the cars speed and the distance.
Solution :
The following CSV file having Speed and Distance attributes with some sample records
CSV file : "speed_distance.csv"
Speed,Distance
90,427
49,155
43,159
75,297
92,430
62,244
.
.
.
.
....
46,158
89,432
55,188
20,37
49,178
To Download complete CSV file with 1000 records : Click Here
R Program: SD_charts.R
# Read the dataset
data <- read.csv("speed_distance.csv")
# Attach variables
attach(data)
# Set up colors
color_speed <- "steelblue"
color_distance <- "tomato"
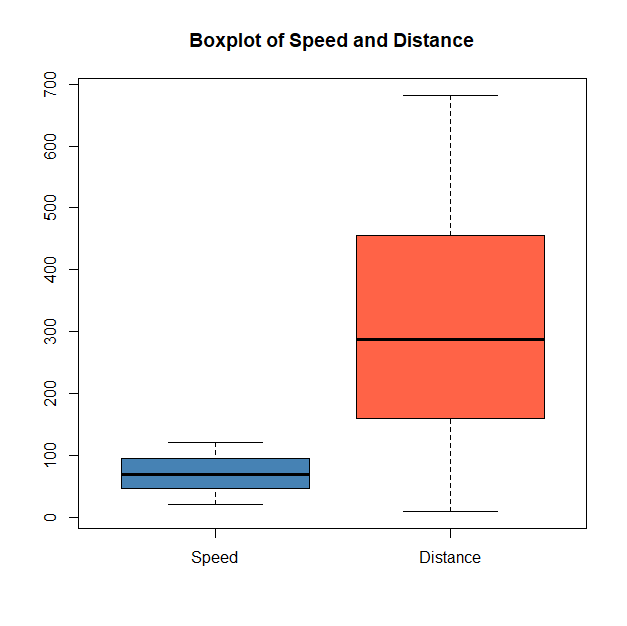
# i) Box Plots
boxplot(Speed, Distance,
names = c("Speed", "Distance"),
main = "Boxplot of Speed and Distance",
col = c(color_speed, color_distance))
windows()
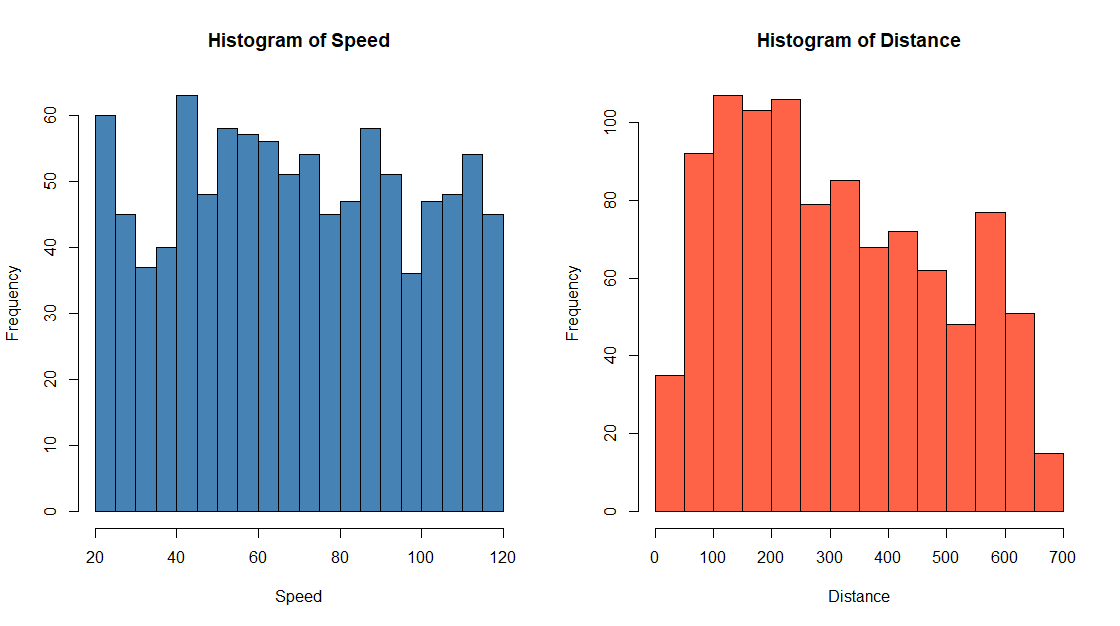
# ii) Histogram
par(mfrow = c(1, 2))
hist(Speed, col = color_speed, main = "Histogram of Speed", xlab = "Speed", breaks = 20)
hist(Distance, col = color_distance, main = "Histogram of Distance", xlab = "Distance", breaks = 20)
par(mfrow = c(1, 1))
windows()
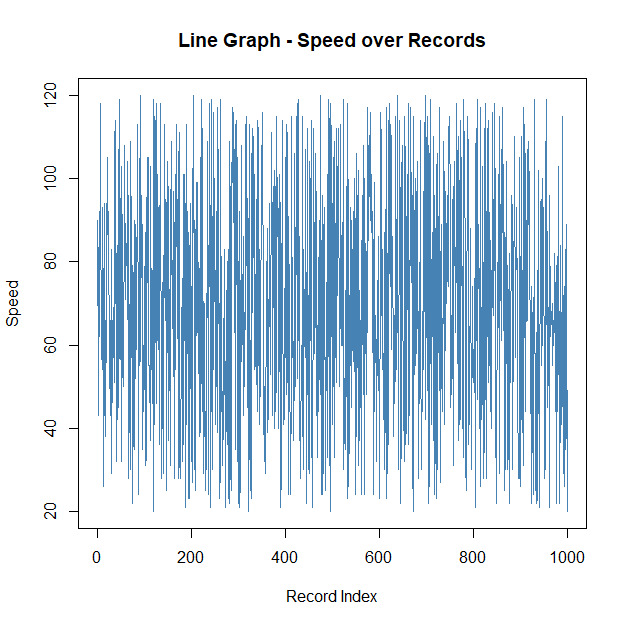
# iii) Line Graph
plot(Speed, type = "l", col = color_speed, main = "Line Graph - Speed over Records", ylab = "Speed", xlab = "Record Index")
windows()
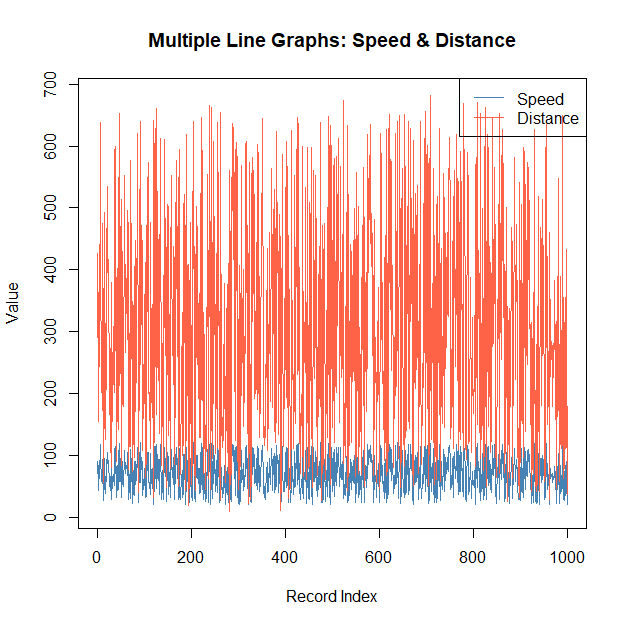
# iv) Multiple Line Graphs
plot(Speed, type = "l", col = color_speed, ylim = range(c(Speed, Distance)),
main = "Multiple Line Graphs: Speed & Distance",
xlab = "Record Index", ylab = "Value")
lines(Distance, type = "l", col = color_distance)
legend("topright", legend = c("Speed", "Distance"), col = c(color_speed, color_distance), lty = 1)
windows()
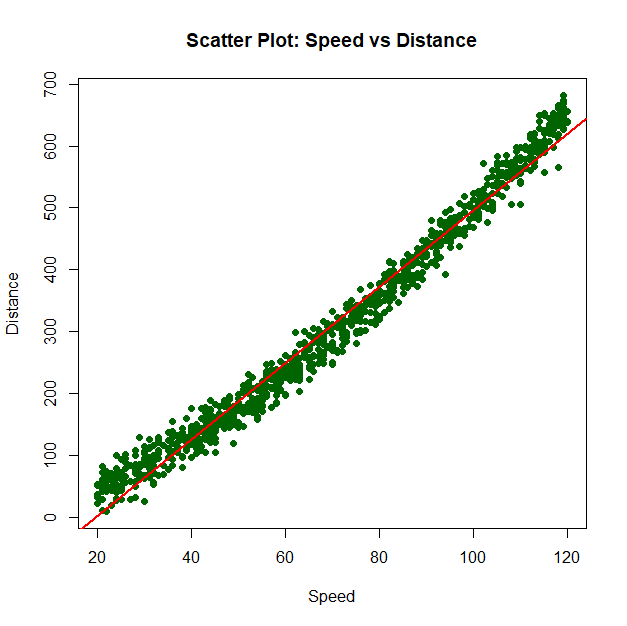
# v) Scatter Plot
plot(Speed, Distance,
main = "Scatter Plot: Speed vs Distance",
xlab = "Speed", ylab = "Distance",
col = "darkgreen", pch = 19)
abline(lm(Distance ~ Speed), col = "red", lwd = 2)
Output:
Box Plots
Histogram
Line Graph
Multiple Line Graphs
Scatter Plot
Related Content :
1. Download and install R-Programming environment and install basic packages using install. packages() command in R. View Solution
2. Learn all the basics of R-Programming (Data types, Variables, Operators etc,.) View Solution
3. Write R command to
i) Illustrate summation, subtraction, multiplication, and division operations on vectors using vectors.
ii) Enumerate multiplication and division operations between matrices and vectors in R console. View Solution
4. Write R command to
i) Illustrates the usage of Vector subsetting and Matrix subsetting
ii) Write a program to create an array of 3 X 3 matrixes with 3 rows and 3 columns. View Solution
5. Write an R program to draw i) Pie chart ii) 3D Pie Chart, iii) Bar Chart along with chart legend by considering suitable CSV file. View Solution
6. Create a CSV file having Speed and Distance attributes with 1000 records. Write R program to draw
i) Box plots
ii) Histogram
iii) Line Graph
iv) Multiple line graphs
v) Scatter plot
to demonstrate the relation between the cars speed and the distance. View Solution
7. Implement different data structures in R (Vectors, Lists, Data Frames). View Solution
8. Write an R program to read a csv file and analyze the data in the file using EDA (Explorative Data Analysis) techniques. View Solution
9. Write an R program to illustrate Linear Regression and Multi linear Regression considering suitable CSV file. View Solution