R Programming - (LAB PROGRAMS)
Aim:
☛ Write an R program to read a csv file and analyze the data in the file using EDA (Explorative Data Analysis) techniques.
Solution :
CSV file : "students.csv"
Name,Age,Gender,Marks
Sona,21,Female,85
Madhu,18,Male,90
Naveen,31,Male,48
Meena,43,Female,92
Mohan,20,Male,
Rina,23,Female,81
Kiran,26,Male,92
Durga,,Male,72
Leena,24,Female,93
Madan,21,Male,25
To Download above CSV file : Click Here
R Program: EDA.R
# Load necessary packages
if(!require(ggplot2)) install.packages("ggplot2")
library(ggplot2)
# Read the CSV file
data <- read.csv("students.csv")
# View first few rows
cat("---- Head of Dataset ----\n")
print(head(data))
# Summary statistics
cat("\n---- Summary Statistics ----\n")
print(summary(data))
# Structure of data
cat("\n---- Structure of Data ----\n")
print(str(data))
# Check for missing values
cat("\n---- Missing Values ----\n")
print(colSums(is.na(data)))
# Frequency of categorical variable
cat("\n---- Gender Count ----\n")
print(table(data$Gender))
# Visualizations
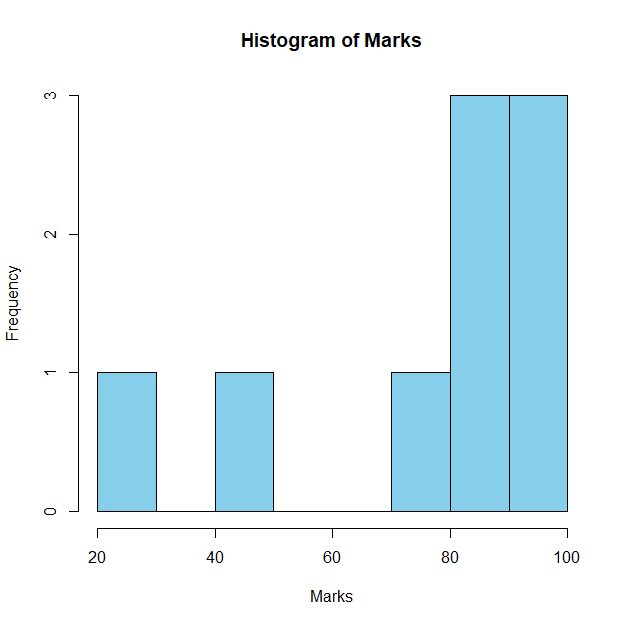
# 1. Histogram of Marks
hist(data$Marks, col="skyblue", main="Histogram of Marks", xlab="Marks")
# To run multiple windows
windows()
# 2. Boxplot of Marks by Gender
boxplot(Marks ~ Gender, data = data, col=c("pink", "lightblue"),
main = "Boxplot of Marks by Gender", ylab = "Marks")
# To run multiple windows
windows()
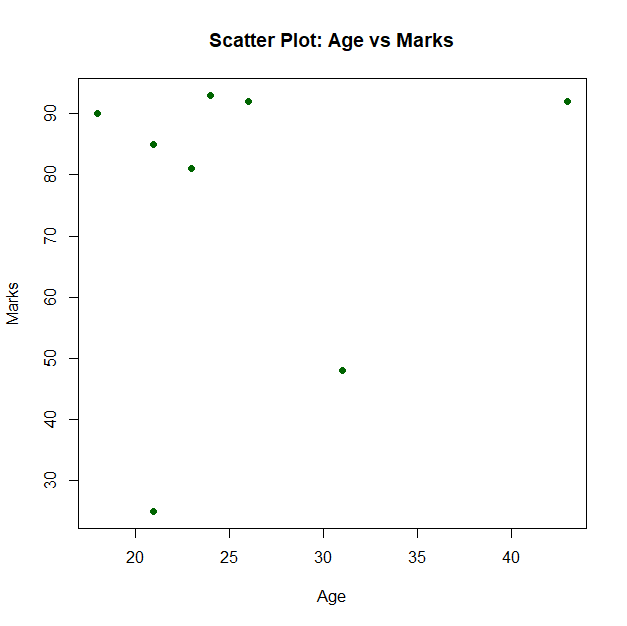
# 3. Scatter Plot: Age vs Marks
plot(data$Age, data$Marks, col="darkgreen", pch=19,
main="Scatter Plot: Age vs Marks",
xlab="Age", ylab="Marks")
Output:
---- Head of Dataset ----
    Name Age Gender Marks
1   Sona  21 Female    85
2  Madhu  18   Male    90
3 Naveen  31   Male    48
4  Meena  43 Female    92
5  Mohan  20   Male    NA
6   Rina  23 Female    81

---- Summary Statistics ----
     Name                Age           Gender              Marks
 Length:10          Min.   :18.00   Length:10          Min.   :25.00
 Class :character   1st Qu.:21.00   Class :character   1st Qu.:72.00
 Mode  :character   Median :23.00   Mode  :character   Median :85.00
                    Mean   :25.22                      Mean   :75.33
                    3rd Qu.:26.00                      3rd Qu.:92.00
                    Max.   :43.00                      Max.   :93.00
                    NA's   :1                          NA's   :1

---- Structure of Data ----
'data.frame':   10 obs. of  4 variables:
 $ Name  : chr  "Sona" "Madhu" "Naveen" "Meena" ...
 $ Age   : int  21 18 31 43 20 23 26 NA 24 21
 $ Gender: chr  "Female" "Male" "Male" "Female" ...
 $ Marks : int  85 90 48 92 NA 81 92 72 93 25
NULL

---- Missing Values ----
  Name    Age Gender  Marks
     0      1      0      1

---- Gender Count ----

Female   Male
     4      6
Histogram of Marks
Boxplot of Marks by Gender

Scatter Plot: Age vs Marks
Related Content :
---- Head of Dataset ----
Name Age Gender Marks
1 Sona 21 Female 85
2 Madhu 18 Male 90
3 Naveen 31 Male 48
4 Meena 43 Female 92
5 Mohan 20 Male NA
6 Rina 23 Female 81
---- Summary Statistics ----
Name Age Gender Marks
Length:10 Min. :18.00 Length:10 Min. :25.00
Class :character 1st Qu.:21.00 Class :character 1st Qu.:72.00
Mode :character Median :23.00 Mode :character Median :85.00
Mean :25.22 Mean :75.33
3rd Qu.:26.00 3rd Qu.:92.00
Max. :43.00 Max. :93.00
NA's :1 NA's :1
---- Structure of Data ----
'data.frame': 10 obs. of 4 variables:
$ Name : chr "Sona" "Madhu" "Naveen" "Meena" ...
$ Age : int 21 18 31 43 20 23 26 NA 24 21
$ Gender: chr "Female" "Male" "Male" "Female" ...
$ Marks : int 85 90 48 92 NA 81 92 72 93 25
NULL
---- Missing Values ----
Name Age Gender Marks
0 1 0 1
---- Gender Count ----
Female Male
4 6
1. Download and install R-Programming environment and install basic packages using install. packages() command in R. View Solution
2. Learn all the basics of R-Programming (Data types, Variables, Operators etc,.) View Solution
3. Write R command to
i) Illustrate summation, subtraction, multiplication, and division operations on vectors using vectors.
ii) Enumerate multiplication and division operations between matrices and vectors in R console. View Solution
4. Write R command to
i) Illustrates the usage of Vector subsetting and Matrix subsetting
ii) Write a program to create an array of 3 X 3 matrixes with 3 rows and 3 columns. View Solution
5. Write an R program to draw i) Pie chart ii) 3D Pie Chart, iii) Bar Chart along with chart legend by considering suitable CSV file. View Solution
6. Create a CSV file having Speed and Distance attributes with 1000 records. Write R program to draw
i) Box plots
ii) Histogram
iii) Line Graph
iv) Multiple line graphs
v) Scatter plot
to demonstrate the relation between the cars speed and the distance. View Solution
7. Implement different data structures in R (Vectors, Lists, Data Frames). View Solution
8. Write an R program to read a csv file and analyze the data in the file using EDA (Explorative Data Analysis) techniques. View Solution
9. Write an R program to illustrate Linear Regression and Multi linear Regression considering suitable CSV file. View Solution