R Programming - (LAB PROGRAMS)
Aim:
☛ Write an R program to illustrate Linear Regression and Multi linear Regression considering suitable CSV file.
Solution :
CSV file : "student_scores.csv"
Hours,Preparation,IQ,Score
2,3,110,50
4,4,105,60
6,5,115,65
8,6,120,80
10,8,125,90
12,9,130,95
14,10,100,90
In the above CSV file,
Hours: Study hours
Preparation: Days of preparation
IQ: Intelligence score
Score: Final exam score (target variable)
To Download above CSV file : Click Here
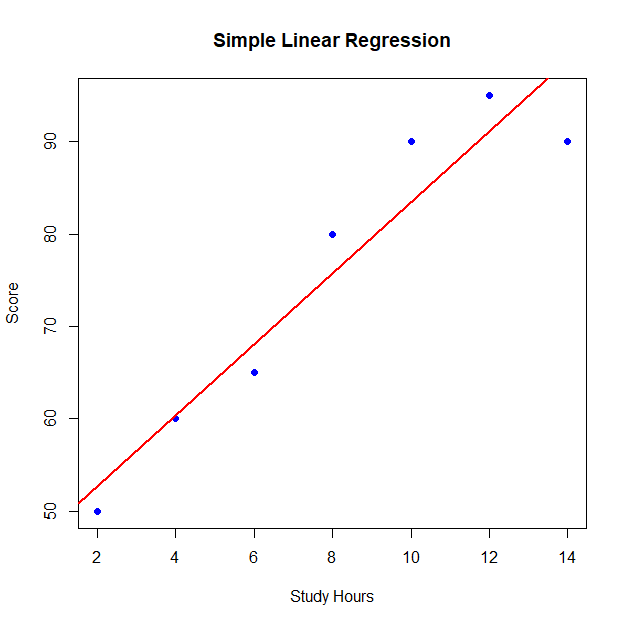
Simple Linear Regression
R Program: Linear_Regression.R
# Load required library
if(!require(ggplot2)) install.packages("ggplot2")
library(ggplot2)

# Read the CSV file
data <- read.csv("student_scores.csv")

# View the data
cat("Dataset:\n")
print(data)

# Simple Linear Regression (Score ~ Hours)
model_linear <- lm(Score ~ Hours, data = data)
cat("\nSimple Linear Regression Summary:\n")
print(summary(model_simple))

# Plotting the regression line
plot(data$Hours, data$Score, main = "Simple Linear Regression",
     xlab = "Study Hours", ylab = "Score", pch = 16, col = "blue")
abline(model_linear, col = "red", lwd = 2)
Output:
Dataset:
  Hours Preparation  IQ Score
1     2           3 110    50
2     4           4 105    60
3     6           5 115    65
4     8           6 120    80
5    10           8 125    90
6    12           9 130    95
7    14          10 100    90

Simple Linear Regression Summary:

Call:
lm(formula = Score ~ Hours, data = data)

Residuals:
      1       2       3       4       5       6
 0.2381  0.8095 -3.6190  1.9524  2.5238 -1.9048

Coefficients:
            Estimate Std. Error t value Pr(>|t|)
(Intercept)  40.3333     2.4462   16.49 7.92e-05 ***
Hours         4.7143     0.3141   15.01 0.000115 ***
---
Signif. codes:  0 '***' 0.001 '**' 0.01 '*' 0.05 '.' 0.1 ' ' 1

Residual standard error: 2.628 on 4 degrees of freedom
Multiple R-squared:  0.9826,    Adjusted R-squared:  0.9782
F-statistic: 225.3 on 1 and 4 DF,  p-value: 0.0001148
Linear Regression
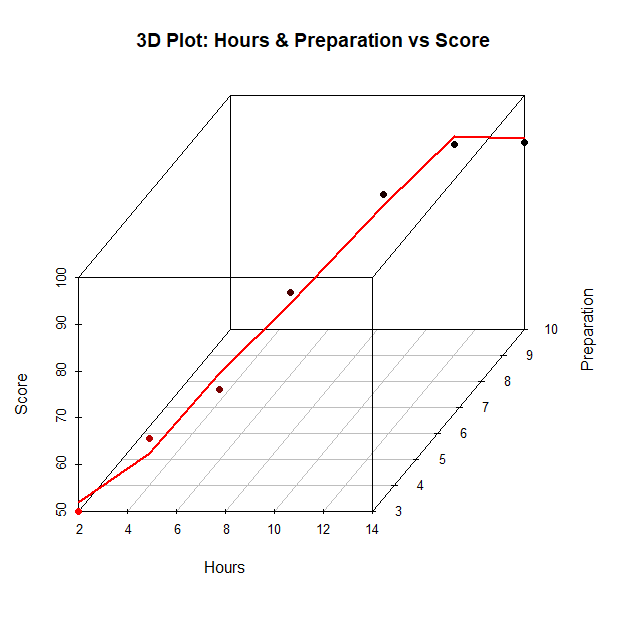
Multiple Linear Regression
R Program: M_Linear_Regression.R
# Load required libraries
if(!require(scatterplot3d)) install.packages("scatterplot3d")
library(scatterplot3d)

# Read the dataset
data <- read.csv("student_scores.csv")

# Multiple Linear Regression model
model_multi <- lm(Score ~ Hours + Preparation + IQ, data = data)
cat("Multiple Linear Regression Summary:\n")
print(summary(model_multi))

# Predict the fitted values
predicted_scores <- predict(model_multi)

# 3D Scatter Plot: using Hours and Preparation as predictors
s3d <- scatterplot3d(data$Hours, data$Preparation, data$Score,
                     pch = 19, color = "blue",
                     xlab = "Hours", ylab = "Preparation", zlab = "Score",
                     main = "3D Plot: Hours & Preparation vs Score",
                     highlight.3d = TRUE, angle = 50)

# Add predicted values as a regression line
s3d$points3d(data$Hours, data$Preparation, predicted_scores,
             col = "red", type = "l", lwd = 2)
Output:
Multiple Linear Regression Summary:

Call:
lm(formula = Score ~ Hours + Preparation + IQ, data = data)

Residuals:
      1       2       3       4       5       6       7
-2.0056  3.0877 -3.3955  2.3134  2.5093 -1.7817 -0.7276

Coefficients:
            Estimate Std. Error t value Pr(>|t|)
(Intercept)  -4.3470    16.9883  -0.256   0.8146
Hours         3.2929     3.4852   0.945   0.4145
Preparation   0.5131     5.7375   0.089   0.9344
IQ            0.4384     0.1453   3.017   0.0569 .
---
Signif. codes:  0 '***' 0.001 '**' 0.01 '*' 0.05 '.' 0.1 ' ' 1

Residual standard error: 3.671 on 3 degrees of freedom
Multiple R-squared:  0.9778,    Adjusted R-squared:  0.9556
F-statistic: 44.04 on 3 and 3 DF,  p-value: 0.005578
Multiple Linear Regression
Related Content :
1. Download and install R-Programming environment and install basic packages using install. packages() command in R. View Solution
2. Learn all the basics of R-Programming (Data types, Variables, Operators etc,.) View Solution
3. Write R command to
i) Illustrate summation, subtraction, multiplication, and division operations on vectors using vectors.
ii) Enumerate multiplication and division operations between matrices and vectors in R console. View Solution
4. Write R command to
i) Illustrates the usage of Vector subsetting and Matrix subsetting
ii) Write a program to create an array of 3 X 3 matrixes with 3 rows and 3 columns. View Solution
5. Write an R program to draw i) Pie chart ii) 3D Pie Chart, iii) Bar Chart along with chart legend by considering suitable CSV file. View Solution
6. Create a CSV file having Speed and Distance attributes with 1000 records. Write R program to draw
i) Box plots
ii) Histogram
iii) Line Graph
iv) Multiple line graphs
v) Scatter plot
to demonstrate the relation between the cars speed and the distance. View Solution
7. Implement different data structures in R (Vectors, Lists, Data Frames). View Solution
8. Write an R program to read a csv file and analyze the data in the file using EDA (Explorative Data Analysis) techniques. View Solution
9. Write an R program to illustrate Linear Regression and Multi linear Regression considering suitable CSV file. View Solution