Predictive Analytics - (LAB PROGRAMS)
Aim:
☛
Multiple Linear Regression
Solution :
Library Installation:
To install required library files, Open Command Prompt or Terminal and execute the following commands
$ pip install scikit-learn

$ pip install numpy

$ pip install matplotlib
PROGRAM: (Multiple_Linear_Regression.py)
# Import libraries
import numpy as np
import matplotlib.pyplot as plt
from sklearn.linear_model import LinearRegression
from sklearn.model_selection import train_test_split
from sklearn.metrics import mean_squared_error, r2_score
# Sample dataset (2 independent variables)
X=np.array([
[1, 2],
[2, 1],
[3, 4],
[4, 3],
[5, 5],
[6, 7],
[7, 6],
[8, 8],
[9, 9],
[10, 10]
])
Y=np.array([5, 6, 9, 10, 13, 17, 18, 21, 24, 27])
# Split data
X_train, X_test, Y_train, Y_test=train_test_split(X, Y, test_size=0.2, random_state=42)
# Create model
model=LinearRegression()
model.fit(X_train, Y_train)
# Predict
Y_pred=model.predict(X_test)
# Print coefficients
print(f"Coefficients (slopes): {model.coef_}")
print(f"Intercept: {model.intercept_}")
# Performance metrics
mse=mean_squared_error(Y_test, Y_pred)
r2=r2_score(Y_test, Y_pred)
print(f"Mean Squared Error: {mse}")
print(f"R-squared: {r2}")
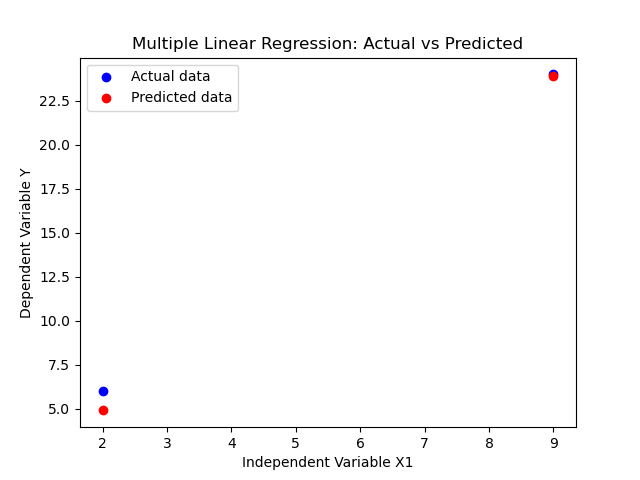
# Visualization (using first feature X1)
plt.scatter(X_test[:, 0], Y_test, color='blue', label='Actual data')
plt.scatter(X_test[:, 0], Y_pred, color='red', label='Predicted data')
plt.title("Multiple Linear Regression: Actual vs Predicted")
plt.xlabel("Independent Variable X1")
plt.ylabel("Dependent Variable Y")
plt.legend()
plt.show()
OUTPUT:
Coefficients (slopes): [1.60343035 0.97089397]
Intercept: 0.7198544698544644
Mean Squared Error: 0.613818475239997
R-squared: 0.9924219941328395
Related Content :
1. Simple Linear regression. View Solution
2. Multiple Linear regression. View Solution
3. Logistic Regression. View Solution
4. CHAID. View Solution
5. CART. View Solution
6. ARIMA - stock market data. View Solution
7. Exponential Smoothing. View Solution
8. Hierarchical clustering. View Solution
9. Ward's method of clustering. View Solution
10. Crowdsource predictive analytics- Netflix data. View Solution