Predictive Analytics - (LAB PROGRAMS)
Aim:
☛
Logistic Regression
Solution :
Library Installation:
To install required library files, Open Command Prompt or Terminal and execute the following commands
$ pip install scikit-learn

$ pip install numpy

$ pip install matplotlib
PROGRAM: (Logistic_Regression.py)
# Import libraries
import numpy as np
import matplotlib.pyplot as plt
from sklearn.linear_model import LogisticRegression
from sklearn.model_selection import train_test_split
from sklearn.metrics import accuracy_score, confusion_matrix, classification_report
# Sample dataset
from sklearn.datasets import make_classification
X, Y = make_classification(n_samples=150, n_features=2, n_redundant=0,
n_informative=2, n_clusters_per_class=1, random_state=42)
# Split dataset
X_train, X_test, Y_train, Y_test = train_test_split(X, Y, test_size=0.2, random_state=42)
# Train model
model = LogisticRegression()
model.fit(X_train, Y_train)
# Predict
Y_pred = model.predict(X_test)
# Evaluation
accuracy = accuracy_score(Y_test, Y_pred)
print(f"Accuracy: {accuracy * 100:.2f}%")
print(f"Confusion Matrix:\n{confusion_matrix(Y_test, Y_pred)}")
print(f"Classification Report:\n{classification_report(Y_test, Y_pred)}")
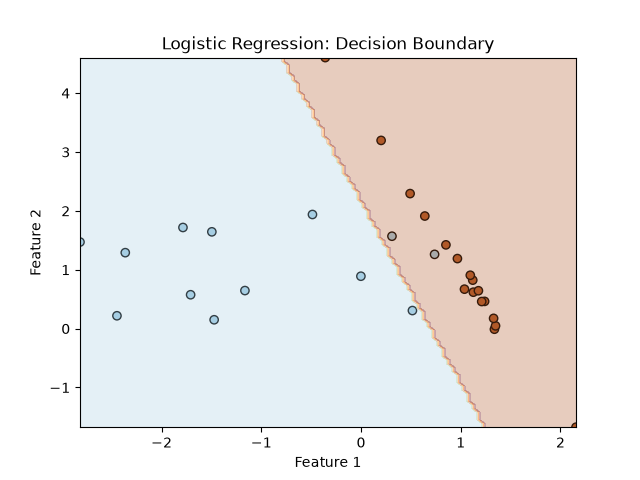
# Visualization
plt.scatter(X_test[:, 0], X_test[:, 1], c=Y_test, cmap=plt.cm.Paired,
marker='o', edgecolors='k')
plt.title("Logistic Regression: Decision Boundary")
plt.xlabel("Feature 1")
plt.ylabel("Feature 2")
# Decision boundary
xx, yy = np.meshgrid(
np.linspace(X_test[:, 0].min(), X_test[:, 0].max(), 100),
np.linspace(X_test[:, 1].min(), X_test[:, 1].max(), 100)
)
Z = model.predict(np.c_[xx.ravel(), yy.ravel()])
Z = Z.reshape(xx.shape)
plt.contourf(xx, yy, Z, alpha=0.3, cmap=plt.cm.Paired)
plt.show()
OUTPUT:
Coefficients (slopes): [1.60343035 0.97089397]
Intercept: 0.7198544698544644
Mean Squared Error: 0.613818475239996
R-squared: 0.9924219941328396

C:\Users\madhu\Downloads\pa>python lr.py
Accuracy: 93.33%
Confusion Matrix:
[[11  2]
 [ 0 17]]
Classification Report:
              precision    recall  f1-score   support

           0       1.00      0.85      0.92        13
           1       0.89      1.00      0.94        17

    accuracy                           0.93        30
   macro avg       0.95      0.92      0.93        30
weighted avg       0.94      0.93      0.93        30
Related Content :
1. Simple Linear regression. View Solution
2. Multiple Linear regression. View Solution
3. Logistic Regression. View Solution
4. CHAID. View Solution
5. CART. View Solution
6. ARIMA - stock market data. View Solution
7. Exponential Smoothing. View Solution
8. Hierarchical clustering. View Solution
9. Ward's method of clustering. View Solution
10. Crowdsource predictive analytics- Netflix data. View Solution