
Simple Linear Regression
Solution :
Library Installation:
To install required library files, Open Command Prompt or Terminal and execute the following commands
$ pip install scikit-learn

$ pip install numpy

$ pip install matplotlib
PROGRAM: (Simple_Linear_Regression.py)
# Import required libraries
import numpy as np
import matplotlib.pyplot as plt
from sklearn.linear_model import LinearRegression
from sklearn.model_selection import train_test_split
from sklearn.metrics import mean_squared_error, r2_score
# Sample dataset (you can replace with your own data)
X = np.array([1, 2, 3, 4, 5, 6, 7, 8, 9, 10]).reshape(-1, 1)
Y = np.array([2, 4, 5, 4, 5, 7, 8, 9, 10, 12])
# Split data into training and testing sets
X_train, X_test, Y_train, Y_test = train_test_split(X, Y, test_size=0.2, random_state=42)
# Create and train the model
model = LinearRegression()
model.fit(X_train, Y_train)
# Make predictions
Y_pred = model.predict(X_test)
# Print model parameters
print(f"Coefficient (slope): {model.coef_}")
print(f"Intercept: {model.intercept_}")
# Calculate performance metrics
mse = mean_squared_error(Y_test, Y_pred)
r2 = r2_score(Y_test, Y_pred)
print(f"Mean Squared Error: {mse}")
print(f"R-squared: {r2}")

# Plot the results
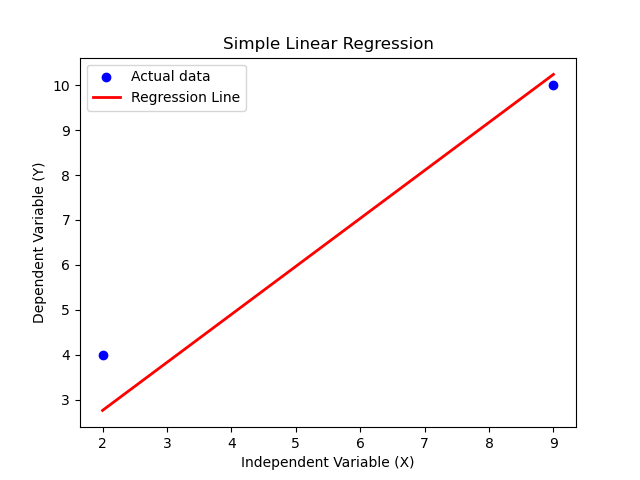
plt.scatter(X_test, Y_test, color='blue', label='Actual data')
plt.plot(X_test, Y_pred, color='red', linewidth=2, label='Regression Line')
plt.title("Simple Linear Regression")
plt.xlabel("Independent Variable (X)")
plt.ylabel("Dependent Variable (Y)")
plt.legend()
plt.show()
OUTPUT:
Coefficient (slope): [1.06896552]
Intercept: 0.6206896551724128
Mean Squared Error: 0.7996432818073731
R-squared: 0.9111507464658475
💻 Run This Python Program
Simple Linear Regression
The selected Python program is loaded
automatically into the editor.
Edit the program, provide input through
STDIN if required
and click Run.
The compiler is embedded using OneCompiler.
Your Python program runs inside the embedded
Python environment; Study Glance does not execute
Python code directly on your web server.
If the program asks for input, type the value in the
STDIN box before clicking Run.
These programs use libraries such as NumPy, Pandas,
Matplotlib, scikit-learn, SciPy and statsmodels, and
graph windows (
plt.show()) cannot be displayed
here. The data files shown in the lesson (CSV) are loaded
into the editor automatically. If a library is not
available in the embedded compiler, use
Copy Program and run the program on your
computer (after pip install of the libraries)
or in Google Colab.