Data Preprocessing
What is Data Preprocessing?
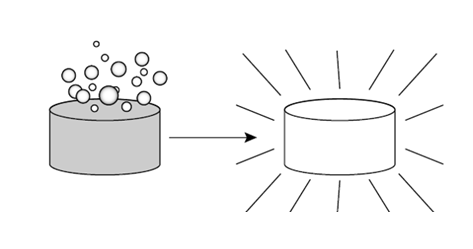
Data preprocessing is a crucial step in data mining. It involves transforming raw data into a clean, structured, and suitable format for mining. Proper data preprocessing helps improve the quality of the data, enhances the performance of algorithms, and ensures more accurate and reliable results.
Why Preprocess the Data?
In the real world, many databases and data warehouses have noisy, missing, and inconsistent data due to their huge size. Low quality data leads to low quality data mining.
Noisy: Containing errors or outliers. E.g., Salary = “-10”
Noisy data may come from
- Human or computer error at data entry.
- Errors in data transmission.
Missing: lacking certain attribute values or containing only aggregate data. E.g., Occupation = “”
Missing (Incomplete) may data come from
- “Not applicable” data value when collected.
- Human/hardware/software problems.
Inconsistent: Data inconsistency meaning is that different versions of the same data appear in different places.For example, the ZIP code is saved in one table as 1234-567 numeric data format; while in another table it may be represented in 1234567.
Inconsistent data may come from
- Errors in data entry.
- Merging data from different sources with varying formats.
- Differences in the data collection process.
Data preprocessing is used to improve the quality of data and mining results. And The goal of data preprocessing is to enhance the accuracy, efficiency, and reliability of data mining algorithms.
Major Tasks in Data Preprocessing
Data preprocessing is an essentialstepin the knowledge discovery process, because quality decisions must be based on qualitydata.And Data Preprocessing involvesData Cleaning, Data Integration, Data Reduction and Data Transformation.
Steps in Data Preprocessing
1. Data Cleaning
Data cleaning is a process that "cleans" the data by filling in the missing values, smoothing noisy data, analyzing, and removing outliers, and removing inconsistencies in the data.
If usersbelieve the data are dirty, they are unlikely to trust the results of any data mining that hasbeen applied.
Real-world data tend to be incomplete, noisy, and inconsistent. Data cleaning (or datacleansing) routines attempt to fill in missing values, smooth out noise while identifyingoutliers, and correct inconsistencies in the data.

Missing Values
Imagine that you need to analyze All Electronics sales and customer data. You note thatmany tuples have no recorded value for several attributes such as customer income. Howcan you go about filling in the missing values for this attribute? There are several methods to fill the missing values.
Those are,
- Ignore the tuple: This is usually done when the class label is missing(classification). This method is not very effective, unless the tuple contains several attributes with missing values.
- Fill in the missing value manually: In general, this approach is time consuming andmay not be feasible given a large data set with many missing values.
- Use a global constant to fill in the missing value: Replace all missing attribute valuesby the same constant such as a label like “Unknown” or “- ∞ “.
- Use the attribute mean or median to fill in the missing value: Replace all missing values in the attribute by the mean or median of that attribute values.
Noisy Data
:Noise is a random error or variance in a measured variable.Data smoothing techniques are used to eliminate noise and extract the useful patterns. The different techniques used for data smoothing are:
Binning: Binning methods smooth a sorted data value by consulting its “neighbourhood,” that is, the values around it. The sorted values are distributed into several “buckets,” or bins. Because binning methods consult the neighbourhood of values, they perform local smoothing.
There are three kinds of binning. They are:- Smoothing by Bin Means:In this method, each value in a bin is replaced by the mean value of the bin. For example, the mean of the values 4, 8, and 15 in Bin 1 is 9. Therefore, each original value in this bin is replaced by the value 9.
- Smoothing by Bin Medians:In this method, each value in a bin is replaced by the median value of the bin. For example, the median of the values 4, 8, and 15 in Bin 1 is 8. Therefore, each original value in this bin is replaced by the value 8.
- Smoothing by Bin Boundaries:In this method, the minimum and maximum values in each bin are identified as the bin boundaries. Each bin value is then replaced by the closest boundary value.For example, the middle value of the values 4, 8, and 15 in Bin 1is replaced with nearest boundary i.e., 4.
Example:
Sorted data for price (in dollars): 4, 8, 15, 21, 21, 24, 25, 28, 34
Partition into (equal-frequency) bins:
Bin 1: 4, 8, 15
Bin 2: 21, 21, 24
Bin 3: 25, 28, 34
Smoothing by bin means:
Bin 1: 9, 9, 9
Bin 2: 22, 22, 22
Bin 3: 29, 29, 29
Smoothing by bin medians:
Bin 1: 8, 8, 8
Bin 2: 21, 21, 21
Bin 3: 28, 28, 28
Smoothing by bin boundaries:
Bin 1: 4, 4, 15
Bin 2: 21, 21, 24
Bin 3: 25, 25, 34- Regression: Data smoothing can also be done by regression, a technique that used to predict the numeric values in a given data set. It analyses the relationship between a target variable (dependent) and its predictor variable (independent).
- Regression is a form of a supervised machine learning technique that tries to predict any continuous valued attribute.
- Regression done in two ways; Linear regression involves finding the “best” line to fit two attributes (or variables) so that one attribute can be used to predict the other. Multiple linear regression is an extension of linear regression, where more than two attributes are involved and the data are fit to a multidimensional surface.
- Clustering:It supports in identifying the outliers. The similar values are organized into clusters and those values which fall outside the cluster are known as outliers.
2. Data Integration
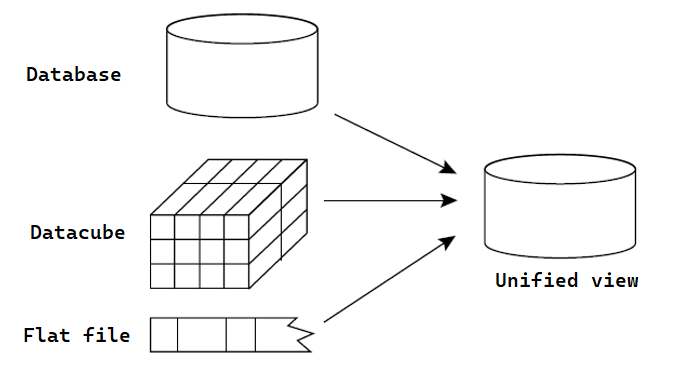
Data integration is the process of combining data from multiple sources into a single, unified view. This process involves identifying and accessing the different data sources, mapping the data to a common format. Different data sources may include multiple data cubes, databases, or flat files.
The goal of data integration is to make it easier to access and analyze data that is spread across multiple systems or platforms, in order to gain a more complete and accurate understanding of the data.
Data integration strategy is typically described using a triple (G, S, M) approach, where G denotes the global schema, S denotes the schema of the heterogeneous data sources, and M represents the mapping between the queries of the source and global schema.

Example: To understand the (G, S, M) approach, let us consider a data integration scenario that aims to combine employee data from two different HR databases, database A and database B. The global schema (G) would define the unified view of employee data, including attributes like EmployeeID, Name, Department, and Salary.
In the schema of heterogeneous sources, database A (S1) might have attributes like EmpID, FullName, Dept, and Pay, while database B's schema (S2) might have attributes like ID, EmployeeName, DepartmentName, and Wage. The mappings (M) would then define how the attributes in S1 and S2 map to the attributes in G, allowing for the integration of employee data from both systems into the global schema.
Issues in Data Integration
There are several issues that can arise when integrating data from multiple sources, including:
- Data Quality:Data from different sources may have varying levels of accuracy, completeness, and consistency, which can lead to data quality issues in the integrated data.
- Data Semantics:Integrating data from different sources can be challenging because the same data element may have different meanings across sources.
- Data Heterogeneity: Different sources may use different data formats, structures, or schemas, making it difficult to combine and analyze the data.
3. Data Reduction
Imagine that you have selected data from the AllElectronics data warehouse for analysis.The data set will likely be huge! Complex data analysis and mining on huge amounts ofdata can take a long time, making such analysis impractical or infeasible.
Data reduction techniques can be applied to obtain a reduced representation of thedata set that ismuch smaller in volume, yet closely maintains the integrity of the originaldata. That is, mining on the reduced data set should be more efficient yet produce thesame (or almost the same) analytical results.
In simple words,Data reduction is a technique used in data mining to reduce the size of a dataset while still preserving the most important information. This can be beneficial in situations where the dataset is too large to be processed efficiently, or where the dataset contains a large amount of irrelevant or redundant information.

There are several different data reduction techniques that can be used in data mining, including:
- Data Sampling: This technique involves selecting a subset of the data to work with, rather than using the entire dataset. This can be useful for reducing the size of a dataset while still preserving the overall trends and patterns in the data.
- Dimensionality Reduction: This technique involves reducing the number of features in the dataset, either by removing features that are not relevant or by combining multiple features into a single feature.
- Data compression:This is the process of altering, encoding, or transforming the structure of data in order to save space. By reducing duplication and encoding data in binary form, data compression creates a compact representation of information. And it involves the techniques such as lossy or lossless compression to reduce the size of a dataset.
4. Data Transformation
Data transformation in data mining refers to the process of converting raw data into a format that is suitable for analysis and modelling. The goal of data transformation is to prepare the data for data mining so that it can be used to extract useful insights and knowledge.

Data transformation typically involves several steps, including:
- Smoothing: It is a process that is used to remove noise from the dataset using techniques include binning,regression, and clustering.
- Attribute construction (or feature construction): In this, new attributes are constructedand added from the given set of attributes to help the mining process.
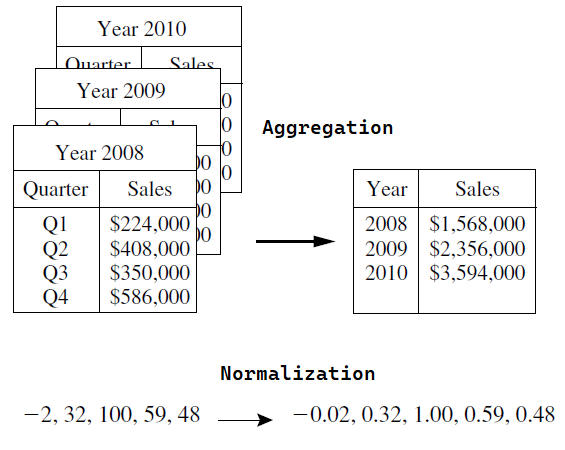
- Aggregation: In this, summary or aggregation operations are applied to the data. Forexample, the daily sales data may be aggregated to compute monthly and annualtotal amounts.
- Data normalization: This process involves converting all data variables into a small range.such as -1.0 to 1.0, or 0.0 to 1.0.
- Generalization: It converts low-level data attributes to high-level data attributes using concept hierarchy. For Example, Age initially in Numerical form (22, ) is converted into categorical value (young, old).
| Method Name | Irregularity | Output |
|---|---|---|
| Data Cleaning | Missing, Nosie, and Inconsistent data | Quality Data before Integration |
| Data Integration | Different data sources (data cubes, databases, or flat files) | Unified view |
| Data Reduction | Huge amounts of data can take a long time, making such analysis impractical or infeasible. | Reduce the size of a dataset and maintains the integrity. |
| Data Transformation | Raw data | Prepare the data for data mining |
Next Topic :Mining Frequent Patterns