Lazy learner(K-NN)
The classification methods discussed so far—decision tree induction, Bayesian classification and rule-based classifications—are all examples of eager learners.
Eager learners, when given a set of training tuples, will construct a classification model before receiving new (e.g., test) tuples to classify. We can think of the model as being ready and eager to classify previously unseen tuples.
Lazy learners simply store training tuples (or perform minimal processing) and wait until a test tuple is encountered. Only when it sees the test tuple does it perform generalization to classify the tuple based on its similarity to the stored training tuples.
Unlike eager learning methods, lazy learners do less work when a training tuple is presented and more work when making a classification or numeric prediction for the test tuple.
When making a classification or numeric prediction, lazy learners can be computationally expensive. They require efficient storage techniques and are well suited to implementation on parallel hardware.
The most popular example of lazy learners is k-Nearest-Neighbor Classifiers.
k-Nearest-Neighbor (KNN) Algorithm / Classifier
The K-Nearest Neighbors (K-NN) algorithm is a popular algorithm used mostly for solving classification problems.
The K-NN algorithm stores all the available data (training data) and classifies a new data point (test data) based on similarity.
In other words, the K-NN algorithm compares a new data point to the data or values in a given dataset (with different classes or categories). Based on its closeness or similarities within a given range (K) of neighbors, the algorithm assigns the new data to a class or category in the training dataset.
It is also called a lazy learner algorithm because it does not learn from the training set immediately. Instead, it stores the dataset and, at the time of classification, performs an action on the dataset.
Why Do We Need a K-NN Algorithm?
Suppose we have two categories, namely Category A and Category B. Now, let's consider a new data point, p1. The question arises: which category does this data point belong to? To address this problem, we can utilize the K-NN algorithm. By employing the K-NN algorithm, we can identify the category or class of a particular dataset.
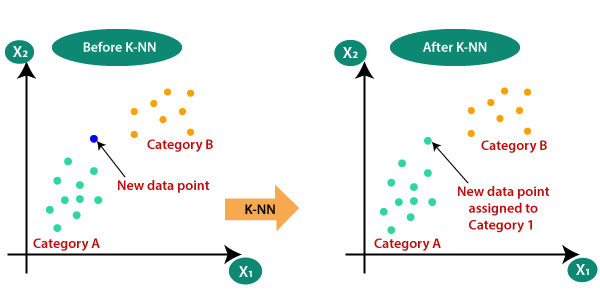
How the k-Nearest-Neighbor (K-NN) Algorithm Works
The algorithm consists of the following steps:
- Choose the value K for the neighbors.
- Compute the distance between the new data point and all other existing data points, and arrange them in ascending order.
- Find the K nearest neighbors to the new data point based on the computed distances.
- Count the number of data points in each category among these K neighbors.
- Assign the new data point to the class or category that has the maximum number of neighbors.
How to Choose the Value of K in the K-NN Algorithm?
There is no specific way of choosing the value K, but here are some common conventions to keep in mind:
- Choosing a very low value will most likely lead to inaccurate predictions.
- The commonly used value of K is 5.
- Always use an odd number as the value of K.
- If the input data has more outliers or noise, a higher value of K would be better.
How to Compute the Distance? (Distance Measures Used in the KNN Algorithm)
The K-NN algorithm enables us to classify or categorize a new data point by calculating its distance from other pre-existing data points. Any of the following distance measures can be used.
Euclidean Distance
Euclidean distance can be simply explained as the ordinary distance between two points. Mathematically, it computes the square root of the sum of squared differences between the coordinates of two objects.
The Euclidean distance between two points or tuples, say, X = (x1, x2, ..., xn) and Y = (y1, y2, ..., yn), is:
d(X,Y) = √[Σi=1n(xi − yi)²]
Manhattan Distance
The Manhattan distance, also called the Taxicab distance or the City Block distance, calculates the distance between two real-valued vectors.
The Manhattan distance metric is generally used when we are interested in the total distance travelled by an object instead of the displacement. This metric is calculated by summing the absolute difference between the coordinates of the points in n-dimensions.
The Manhattan distance between two points or tuples, say, X = (x1, x2, ..., xn) and Y = (y1, y2, ..., yn), is:
d(X,Y) = Σi=1n|xi − yi|
Example: Calculate Euclidean and Manhattan Distance
Let X = (1, 2) and Y = (3, 5) represent two data points.
The Euclidean distance between the two data points is:
√[(3 − 1)² + (5 − 2)²] = √(4 + 9) = √13 ≈ 3.61
The Manhattan distance between the two data points is:
|3 − 1| + |5 − 2| = 2 + 3 = 5
Note: Euclidean distance is the most popular distance measure to calculate the distance between data points or tuples.
Example: Classify a Person Using K-NN
Consider the following training dataset. Each row contains a person's height, weight, and class label.
| Height (in CM) | Weight (in KG) | Class |
|---|---|---|
| 189 | 87 | Normal |
| 149 | 61 | Overweight |
| 189 | 104 | Overweight |
| 195 | 81 | Normal |
| 155 | 51 | Normal |
| 191 | 79 | Normal |
| 190 | 95 | Overweight |
| 157 | 56 | Normal |
| 185 | 76 | Normal |
| 161 | 72 | Overweight |
| 164 | 75 | Overweight |
| 149 | 66 | Overweight |
Apply the K-NN algorithm to find the class label for this test tuple:
| Height (in CM) | Weight (in KG) | Class |
|---|---|---|
| 148 | 60 | ? |
Solution
In the given dataset, we have two columns—Height (in CM) and Weight (in KG). Each row in the dataset has a class of either Normal or Overweight.
Step 1: Choose K
To start working with K-NN, first choose the value for K. Let us assume that K = 5.
Step 2: Calculate the Distance
Calculate the distance between the new (test) tuple and all other tuples in the existing (training) dataset. Here, the Euclidean distance measure is used.
The new (test) data entry is Height = 148 and Weight = 60.
Use the formula:
d = √[(X2 − X1)² + (Y2 − Y1)²]
Where:
- X2 = new entry's height (148).
- X1 = existing entry's height.
- Y2 = new entry's weight (60).
- Y1 = existing entry's weight.
Distance 1
For the first row, height = 189, weight = 87, and class = Normal:
d1 = √[(148 − 189)² + (60 − 87)²]
= √1681 + 729 = √2410 ≈ 49.1
| Height (in CM) | Weight (in KG) | Class | Distance |
|---|---|---|---|
| 189 | 87 | Normal | 49.09 |
Distance 2
For the second row, height = 149, weight = 61, and class = Overweight:
d2 = √[(148 − 149)² + (60 − 61)²] = √2 ≈ 1.41
| Height (in CM) | Weight (in KG) | Class | Distance |
|---|---|---|---|
| 149 | 61 | Overweight | 1.41 |
Distance 3
For the third row, height = 189, weight = 104, and class = Overweight:
d3 = √[(148 − 189)² + (60 − 104)²]
= √1681 + 1936 ≈ 60.14
The distances for the remaining data entries are calculated in the same way.
Updated Dataset with Distances
| Height (in CM) | Weight (in KG) | Class | Distance |
|---|---|---|---|
| 189 | 87 | Normal | 49.09 |
| 149 | 61 | Overweight | 1.41 |
| 189 | 104 | Overweight | 60.14 |
| 195 | 81 | Normal | 51.48 |
| 155 | 51 | Normal | 11.40 |
| 191 | 79 | Normal | 47.01 |
| 190 | 95 | Overweight | 54.67 |
| 157 | 56 | Normal | 9.85 |
| 185 | 76 | Normal | 40.31 |
| 161 | 72 | Overweight | 17.69 |
| 164 | 75 | Overweight | 21.93 |
| 149 | 66 | Overweight | 6.08 |
Step 3: Arrange Distances in Ascending Order
Arrange the distances in ascending order and consider the first five rows because K = 5.
| Height (in CM) | Weight (in KG) | Class | Distance |
|---|---|---|---|
| 149 | 61 | Overweight | 1.41 |
| 149 | 66 | Overweight | 6.08 |
| 157 | 56 | Normal | 9.85 |
| 155 | 51 | Normal | 11.40 |
| 161 | 72 | Overweight | 17.69 |
Step 4: Count the Neighbors in Each Class
In the above five nearest neighbors, three neighbors have Overweight as a class and two neighbors have Normal as a class.
Step 5: Assign the Class
As shown above, the class Overweight has the maximum number of neighbors. Therefore, the new entry/tuple is classified as Overweight.
| Height (in CM) | Weight (in KG) | Class |
|---|---|---|
| 148 | 60 | Overweight |
Advantages of the K-NN Algorithm
- It is simple to implement.
- No training is required before classification.
Disadvantages of the K-NN Algorithm
- It can be cost-intensive when working with a large dataset.
- A lot of memory is required for processing large datasets.
- Choosing the right value of K can be tricky.
Exercise
Consider the following training dataset and apply the K-NN algorithm to find the class label for the test tuple.
| Brightness | Saturation | Class |
|---|---|---|
| 40 | 20 | Red |
| 50 | 50 | Blue |
| 60 | 90 | Blue |
| 10 | 25 | Red |
| 70 | 70 | Blue |
| 60 | 10 | Red |
| 25 | 80 | Blue |
The test tuple is:
| Brightness | Saturation | Class |
|---|---|---|
| 20 | 36 | ? |